Angus and Rosemary's Miscellany
of Malvern - Other Resources
|
Coronavirus (COVID-19) epidemic weekly update for Malvern SeniorsCOVID TIER 2 CONTROL MEASURES Page archived 13th December 2020 Skip to menu of archived pages T'is the Season to be Jolly Careful - says the Prime Minister PreambleWe keep an eye on the published government figures to asses the level of risk in the Malvern Hills district, if there is an uptick in cases we will tell you. This page is updated every Sunday between 1800 and 2400 hours GMT. Information about Coronavirus can be found on the NHS website: https://www.nhs.uk/coronavirus
|
 How
to request a test
How
to request a test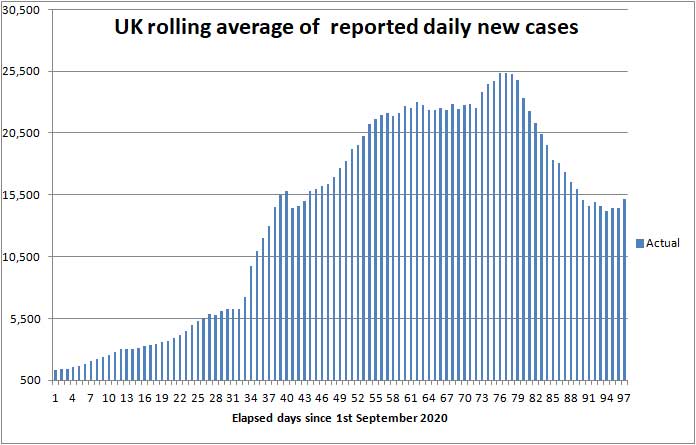
| Districts of Worcs | Cases | Weekly increase | Population |
| Bromsgrove | 2,396 | +122 | 98,529 |
| Malvern Hills | 970 | +49 | 77,545 |
| Redditch | 2,082 | +98 | 85,317 |
| Worcester | 1,948 | +82 | 103,542 |
| Wychavon | 1,935 | +79 | 126,240 |
| Wyre Forest | 2,106 | +95 | 100,957 |
| TOTAL | 11,437 | +525 | 592,130 |
| COMPARE WITH | |||
| County of Hereford | 2,562 | +122 | 195,000 |
| Leicester (city of) | 18,367 | +946 | 400,000 |
Cumulative cases reported by PHE in Worcestershire to 6th December 2020
There are signs that the recent fall in daily new cases in Worcestershire may be slowing.
At the bottom of the Coronavirus Dashboard (daily update) page there is an Interactive Map which is coloured to show the variation in infection rates across the country. This shows the level of infection across England reduced considerably during the second lockdown, but there is still more to do.
If you keep clicking the plus sign (+) to enlarge the map eventually you will see for example areas of Malvern, Guarlford and Madresfield; if you click each of these a box pops up which shows the number of cases in the last reported seven days, and a rolling average normalised to 100,000 population per week so rates can be compared across the country.
Note: the Interactive Map works on desktop PCs but you may encounter difficulties using a tablet or smartphone.
Click for Interactive Map of COVID cases
Recent weekly cases to 1st Dec have been: Malvern Wells and Priory 6; North Malvern 3; Malvern Link 5; Pickersleigh 10; Upton and Welland 8; the picture changes daily.
Number of deaths
Statistics on deaths are published by Public Health England, The Office of National Statistics, and NHS England.
Last week 20 COVID deaths were reported in Worcestershire, but only 15 this week.
PHE figures
Public Health England reports that the cumulative total of COVID (28) deaths in UK hospitals and care homes has risen by 3,000 this week to 61,245 while the rolling 7 day average has fallen from 460 deaths per day to 429; in comparison averaged over recent years 1,700 people die daily from all causes.
Most of these COVID deaths are currently in the north of England and South Wales where infection rates have been highest.
We think the daily death rate should generally decline during the remainder of December, though there could be a bump next week caused by people holding 'coronavirus parties' just before the second lockdown.
Click to view the UK government Coronavirus Dashboard
ONS figures
The Office of National Statistics (ONS) separately reports registered deaths in England and Wales where COVID-19 is mentioned on the death certificate. The ONS figures lag the PHE figures by 10 - 14 days and do not include NI and Scotland, so are lower than the figures published by PHE.
The figures are broken down by District so one can glimpse where deaths are occurring. The cumulative total of COVID related deaths in Worcestershire reported by the ONS up to 20th November is shown below.
| Districts of Worcs | Deaths | Weekly increase | Population |
| Bromsgrove | 139 | +3 | 98,529 |
| Malvern Hills | 50 | +1 | 77,545 |
| Redditch | 64 | 0 | 85,317 |
| Worcester | 71 | +4 | 103,542 |
| Wychavon | 123 | +4 | 126,240 |
| Wyre Forest | 133 | +4 | 100,957 |
| TOTAL | 580 | +16 | 592,130 |
Cumulative COVID deaths registered by ONS to 20th November 2020
In the week ending 20th November, there were 16 COVID deaths in Worcestershire of which 2 were in a care home, and 3 at home; 1 was in a hospice and 10 in hospital.
In total in England and Wales 2,917 COVID related deaths were reported by ONS in the week to 20th November, an increase of 263 (10%) on the week before showing the death rate continued to rise only slightly. Of these 525 were in Care Homes, 154 at home, 37 in a Hospice and 2,185 in hospital. The highest number of hospital deaths (>19) by Lower Tier Local Authority were:
East Riding of Yorkshire 23, Nottingham 24, Oldham 23, Rochdale 27, Tamesdie 25, Wigan 43, Liverpool 35, Sefton 22, Barnsely 26, Doncaster 27, Sheffield 26, Sunderland 21, Birmingham 48, Sandwell 26, Bradford 31, Kirklees 24, Leeds 52, Wakefield 27, Rhondda Cynon Taf 21, Aneurin Bevin University Health Board 36, Cwm Taf Morgannwg University Health Board 44, Swansea Bay University Health Board 27.
Click for national ONS data on deaths (Excel spreadsheet)
NHS England figures
More recently in the seven days ending 5th December NHS England reported 15 deaths in Worcestershire hospitals.
Click for NHS COVID-19 Daily Deaths
Healthcare numbers
The UK government Coronavirus Dashboard includes important information about COVID-19 patients currently in hospital.
| Hospital cases (UK) | Number | Weekly change |
| Patients in hospital | 14,556 | -1,156 |
| Patients on ventilation | 1,274 | -143 |
| Patients admitted daily | 1,444 | -127 |
Headline summary of patients in hospital as reported 6th December 2020
Although these headline figures are not updated regularly they are useful indicators and show the epidemic is reducing, albeit at a very slow pace.
Very sick COVID patients are said to arrive in hospital 7 to 10 days after first symptoms, and either die or are discharged 15 to 30 days after first symptoms in most cases. Hospital beds are occupied by suspected COVID patients, very sick COVID patients, and a few suffering from 'Long COVID' who may remain in hospital for much longer than 30 days.
Notes on projected figures
It appears hospitals are only admitting very sick COVID-19 patients, for example those with breathing difficulties, which is probably why Professor Peter Horby of Oxford University said on the Andrew Marr show that up to 20% of COVID patients in hospital could die.
If this is correct, the current admission rate of 1,444 new COVID patients per day points to up to 288 hospital deaths per day, to which must be added forecast COVID deaths in other settings such as Care Homes. Adding 25% for the latter suggests up to 360 deaths per day around Christmas.
Statistician Sir David Spiegelhalter of Cambridge University speaking separately on BBC TV said that, using his rule of thumb, hospital admissions were likely to be about 10% of reported new cases, one week after symptoms; and deaths were likely to be about 2% of new cases, 2 to 3 weeks after that - which would point towards about 300 deaths per day in the second half of December.
Empirically, we judge the daily death rate rolling average is roughly 1.9% of the 7 day rolling average of new cases delayed by 21 days.
During September and October the actual second wave numbers fitted a truncated exponential series which we used to forecast a week ahead. Since then the rate has slowed - approximating more closely to an S shaped Logistic curve which we have used as a guide in producing the forecast below.
Forecast for the week ahead
Trends suggest that during the next seven days (up to 13th December) the cumulative total of new UK COVID-19 cases reported by PHE on the Coronavirus Dashboard can be expected to increase by about 105,000 towards 1,828,000 cases.
In Worcestershire up to 560 new cases of COVID-19 can be expected, and possibly up to 50 cases in the Malvern Hills district.
As the (average) daily death rate seems to have peaked and begun to fall it might be expected that the daily death rate would decline next week. On the other hand because of the increase in daily new cases following the start of the second lockdown, which we put down to people holding coronavirus parties immediately before the lockdown started, we anticipate the death rate could flat-line next week at about 450 deaths per day.
Hence we estimate the number of COVID (28) deaths could increase by about 3,150 nationally towards 64,400 during the 7 days ending 13th December
In the county of Worcestershire, assuming a 2% death rate, the 525 new cases this week could translate to a maximum of 10 Worcestershire deaths per week in the latter half of December, but if cases are mostly confined to younger age groups it could be less.
Longer term forecast
Looking to the longer term, based on the recent fall in daily new cases and using the 'rules of thumb' mentioned above, we anticipate the national daily death rate will gradually decline during December (see commentary).
The chart below shows deaths to date in red and a revised projection of future COVID deaths up to the end of December in blue which assumes the death rate falls progressively towards 200 deaths per day by the end of the year.
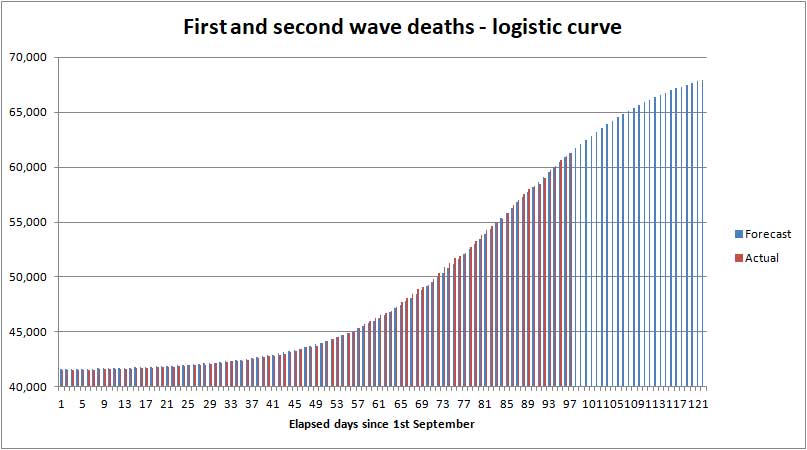
Revised forecast of UK cumulative COVID deaths to 31st December
In those areas where the COVID death rate is highest, such as in the North of England and South Wales, for a short period while the second wave death rate is near its peak the storing of bodies in temporary mortuaries and some delay to funeral services cannot be ruled out between now and early January; though this is unlikely to be the case in Worcestershire where the COVID death rate remains low.
Providing people continue to act sensibly there could be a further reduction of daily new cases during December with a consequential further slowing of the daily death rate in January 2021, by which time the vaccination programme should begin to ramp up for small numbers of NHS staff, care workers, and the most elderly. That is the rosy picture.
More likely however there could be a third wave of the COVID epidemic in January, caused by excessive travel and mingling over Christmas, leading to a possible extension of restrictions.
Realistically, it may take until the summer to vaccinate 50% of the UK population, but Seniors should take heart that they are likely to be near the front of the queue.
Advice for Seniors

Despite the infection rate declining, COVID is still widespread and there are pockets of infection across the Malvern Hills and Worcestershire, so we consider the risk to be MODERATE to HIGH for Seniors living in the Malvern Hills district; see our annex and riskometer opposite.
If you are unlucky and catch COVID there is a significant chance that you will either die or your long term health may be seriously damaged, so take care to protect yourself and those you love. 90% of COVID deaths are in those aged over 60 years according to NHS England statistics.
Apart from relaxation of restrictions between 23rd and 27th December you must not mix with other households.
Although the government will be easing restrictions over Christmas, risk averse Seniors should consider not mixing indoors in large family groups; unless vaccinated. Instead, perhaps consider inviting a lonely friend round for Christmas lunch and communicating with family using, for example, either Skype, Facetime or Zoom.
In any event, think carefully about what you are doing, who you are doing it with, and where you are mixing.
The simple safeguards to remember are still to:
-
wash your hands thoroughly, using soap and hot water, for 20 seconds, including after handling deliveries to your home (HANDS) see note 1;
-
wear a face mask when appropriate for example when shopping or visiting the chemist (FACE);
-
avoid mingling especially in crowded places, and continue with precautions such as physical distancing by 2 metres (SPACE) keeping proximity with others brief (TIME) see notes 2 and 3.
Hence the mantra:-
HANDS, FACE, SPACE, TIME - GET A TEST if you feel unwell.
Click for UK government Coronavirus guidance on what you can and cannot do
Remember, if you have symptoms of COVID-19 and can't count from one to ten out loud due to shortness of breath, you should immediately call your GP, 111 or 999 for advice.
Notes:
1) Wash your hands thoroughly before touching your face to avoid transferring virus from surfaces to your mouth, eyes and nose. If outdoors use hand gel.
2) Minimise time spent mixing with people outside your household in indoor settings - an invisible mist of virus can build up in the air if the space is shared with an infectious person; imagine people exhaling cigarette smoke. Unless you wear a hospital grade face mask you can breath this in; a face covering will offer little or no protection. The likelihood and extent you get sick will depend on the density of the airborne virus, which can be reduced by ventilation, and your exposure time.
3) Two metres is further than you think, and roughly an arm and a walking stick away - difficult to chat if the person you are talking to is hard of hearing!
Annex to 6th December update
Commentary
Apart from BREXIT, talk in the media this week has been mostly about approval of the Pfizer BioNTech COVID vaccine for use in the UK. Click for NHS information
MHDC has sent a useful Coronavirus update to those subscribing to email news, and Dr Kathryn Cobain Public Health Worcester has held a Q&A session on Youtube. Click to view the Tier 2 Q&A session with Dr Kathryn Cobain.
The UK has ordered 40 million doses of the Pfizer jab, enough to vaccinate 20 million people and 800,000 doses are on their way.
Nadhim Zahawi MP has been appointed to lead on distribution of the vaccine who will be supported by General Sir Gordon Messenger and the Military. Click for BBC report
The possibility of using the same network as used to deliver winter flu jabs has been suggested, but the problem with the Pfizer vaccine is that it needs to be stored at -70 deg C and can't easily be broken down into packs of less than 975 doses. We'll have to wait and see how the vaccine will be rolled out over coming weeks. Expect to be told when it is your turn to be vaccinated; please don't pester the surgery unless you feel you have been missed.
Today's news is that the vaccine will first be distributed to 50 regional NHS hospitals acting as hubs and vaccination will start on Tuesday 8th December. Some newspapers include Worcestershire Acute hospitals Trust on the list and some do not. Herefordshire hospitals are not listed.
Dr Chris Smith speaking on Radio 5 said that as the natural reproduction rate of the COVID virus was about 3 then two thirds of the population might need to be vaccinated to achieve herd immunity which could take all year; Matt Hancock hopes to have the most elderly and vulnerable vaccinated by the spring in order to reduce the death rate and load on the NHS.
Tiered COVID restrictions will probably need to be continued until at least the spring and possibly towards autumn. MPs have voted to approve the continuation of the present tiered controls at least in the short term although about 50 Conservative MPs voted against the measures and the Labour Party led by Sir Keir Starmer abstained.
Priority for vaccination
The Joint Committee on Vaccinations and Immunisation (JCVI) has withdrawn its original guidance and produced new proposals capable of flexible interpretation, but broadly giving priority to the elderly.
Click for JCVI guidance on vaccination priorities
Quantifying the danger of mingling at Christmas
Relaxation of restrictions over Christmas will lead to additional deaths and possibly a third wave of the epidemic. Here is last week's back of the envelope worst case calculation:
Assume 66 million people in the UK, who divide into bubbles of 10 creating 6.6 million bubbles. Assuming an infection rate of 100 per 100,000 then 1% of bubbles will contain at least one infectious person, that is 66,000 bubbles. Cooped up indoors together assume the other 9 in the bubble are infected, suggesting a worst case of 600,000 new 'index' COVID cases due to relaxation of the COVID restrictions - a huge number.
If people of all ages mix then 2% can be expected to die, perhaps 12,000 immediate additional deaths in the second half of January, of which 90% would be aged 60+ years, to which would have to be added later deaths amongst their contacts.
The message seems clear: the easing of restrictions over Christmas would very likely lead to a third wave of the epidemic and a significant number of deaths.
However looked at from another angle the majority of family gatherings (>99%) would probably be infection free. So take your pick!
Our recommendation is that risk averse Seniors should consider declining Christmas gatherings this year, unless they have a life limiting condition and feel that this may be their last. That in itself would be unlikely to stop a third wave of the epidemic but could reduce additional deaths to < 1,000.
Do tell us if you can provide a more reliable estimate.,
Recent deaths in Worcestershire hospitals
The table below shows COVID deaths in Worcestershire Acute Hospitals Trust reported by NHS England to 5th December.
| Date | Number |
| 29th November | 3 |
| 30th November | 3 |
| 1st December | 1 |
| 2nd December | 5 |
| 3rd December | 3 |
| 4th December | 0 |
| 5th December | 0 |
| Total | 15 |
Worcester Acute Trust hospitals COVID deaths in 7 days to 5th December
To date a total of 358 COVID deaths have been reported in Worcester Acute hospitals and 31 in 'Care' hospitals.
Present rate of new cases
This week, the average rate of infection per 100,000 population per week in England fell from 175 to 150. In comparison the figure for Worcestershire is 100 and that in the Malvern Hills 55; so the Malvern Hills remains the safest district in Worcestershire and compares well with the city of Leicester where the rate of infection is five times higher.
Nevertheless Seniors should continue to be careful.
The probability of catching Coronavirus in the Malvern Hills is moderate, and continuing to fall but combined with the significant risk of death makes us view the overall risk to Seniors as MODERATE to HIGH. If Seniors were to visit hotspots such as Bristol, Staffordshire, Leicester or Hull we would assess the risk HIGH.
The risk of death from Coronavirus for healthy teenagers is exceedingly small so for them the risk is LOW, whereas the middle aged can suffer from Long COVID so for them the risk might be assessed MODERATE.
Forecast of death rate during December
Last week we made a rough estimate of the future daily death rate - emphasising that while one can't go far wrong extrapolating a week ahead, forecasting the death rate one month ahead is little more than a shot in the dark.
Using an Excel spreadsheet, we fitted the actual death rate to an S shaped curve (or logistic function) and used that to project how the death rate might fall in December. However during the last week the actual death rate roughly flat-lined so we have delayed the peak in the curve. We have also added a further estimate based on 1.9% of the rolling average of new cases delayed 21 days - shaded green in the chart below.
Based on the number of daily cases there could be a small bump in the death rate next week caused by people holding coronavirus parties immediately before the start of the second lockdown; the death rate might then fall for a while and then plateau due to increased mingling and Christmas shopping following the ending of the lockdown.
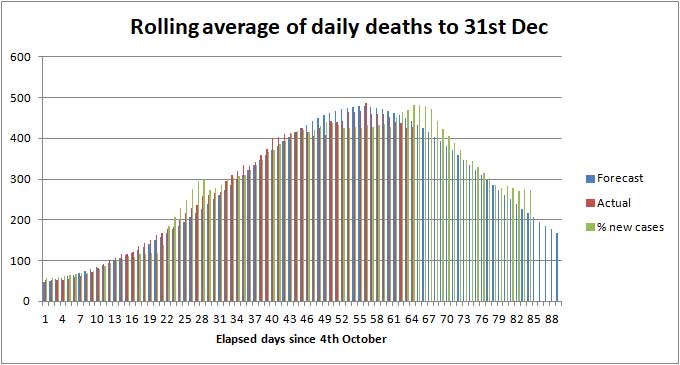
Illustration of possible death rate to 31st December
The present COVID death rate is bound to fall, but there is considerable uncertainty about how fast and whether there will be bumps in the road caused for example by Christmas shopping, university students returning home, and restrictions being eased over Christmas enabling households to mingle. We will just have to wait and see what actually happens!
Summary of Links
Symptoms
Article about the effects of Coronavirus on the human body
Reporting and how to obtain a test
How to get a test
https://www.nhs.uk/coronavirus
About joining the Zoe COVID Symptom Study:
Guidance
UK government Coronavirus guidance
Statistics
UK government Coronavirus Dashboard
Coronavirus Dashboard Interactive map
ONS data on deaths in England and Wales (Excel spreadsheet)
Snapshots of deaths in hospital in England. This is not consolidated, so best see the Coronavirus Dashboard to view trends.
Reports
National COVID-19 surveillance reports
ONS Coronavirus (COVID-19) roundup: Deaths and health
The bigger picture
Worldometer summary of coronavirus cases worldwide
European Centre for Disease Prevention and Control info
https://www.ecdc.europa.eu/en/geographical-distribution-2019-ncov-cases
World Health Organisation info
Window on the USA
Centre for Disease Control (CDC)
American Association of Retired People (AARP)
Worcestershire
Help
http://www.worcestershire.gov.uk/here2help
Outbreak Control Plan
http://www.worcestershire.gov.uk/coronavirus
Miscellaneous
Spanish Flu
Dr Jeff Kildea's commentary about the 1919 outbreak of Spanish Flu in Australia
Views of Martin McKee, Professor of European Public Health
Follow Martin McKee on Twitter
SAGE membership
Scientific Advisory Group for Emergencies (SAGE)
Scottish government:
Link to Scottish Government website
Link to Postcode checker for COVID restrictions by protection level in areas of Scotland
Welsh Government:
Guidance on how you can keep safe during the outbreak and what rules are in place to protect people
![]()
The interpretations and opinions expressed are our own
Last updated 6th December 2020