Angus and Rosemary's Miscellany
of Malvern - Other Resources
|
Coronavirus (COVID-19) epidemic weekly update for Malvern SeniorsCOVID TIER 3 CONTROL MEASURES MOVING TO NATIONAL LOCKDOWN Alert Level raised to 5 on January 4th Cases rising steeply nationally Skip to menu of archived pages PreambleWe keep an eye on the published government figures to asses the level of risk in the Malvern Hills district, if there is an uptick in cases we will tell you. This page is updated every Sunday between 1800 and 2400 hours GMT. Information about Coronavirus can be found on the NHS website: https://www.nhs.uk/coronavirus
|
 How
to request a test
How
to request a test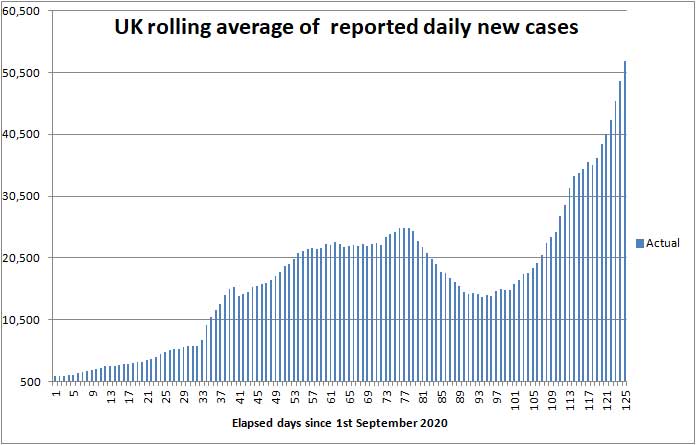
| Districts of Worcs | Cases | Weekly increase | Population |
| Bromsgrove | 3,543 | +449 | 98,529 |
| Malvern Hills | 1,361 | +173 | 77,545 |
| Redditch | 2,917 | +375 | 85,317 |
| Worcester | 2,740 | +427 | 103,542 |
| Wychavon | 2,948 | +405 | 126,240 |
| Wyre Forest | 3,012 | +413 | 100,957 |
| TOTAL | 16,521 | +2,242 | 592,130 |
| COMPARE WITH | |||
| County of Hereford | 3,790 | +605 | 195,000 |
| Leicester (city of) | 22,858 | +1,623 | 400,000 |
Cumulative cases reported by PHE in Worcestershire to 3rd January 2021
Cases both locally and nationally have surged in the last week.
Interactive map
At the bottom of the Coronavirus Dashboard (daily update) page there is an Interactive Map which is coloured to show the variation in infection rates across the country. The large purple patches show the highest rate of infection expanding in the south eastern quadrant of England and South Wales, but if you enlarge the map you will also see smaller patches of purple seeding across the country indicating the epidemic is spreading largely out of control.
Click for Interactive Map of COVID cases
Note: the Interactive Map works on desktop PCs but it's possible you may encounter difficulties using a tablet or smartphone.
In the last few days cases in Malvern and surrounds have begun rising steeply possibly due to households mixing over Christmas.
Recent weekly cases to 29th December are: North Malvern 9; Malvern Link 13; Pickersleigh 9; Barnards Green 7; Malvern Wells and Priory 15; Callow End and Hanley 19; Upton and Welland 28. The picture changes daily.
Number of deaths
Statistics on COVID deaths are published by Public Health England, The Office of National Statistics, and NHS England.
Jointly these show that the daily death rate which has roughly flat-lined at 400 deaths per day for 6 weeks is now showing an upward trend.
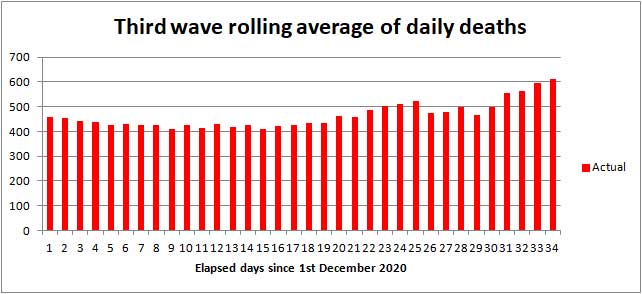
Daily UK death rate since 1st December 2020 (source PHE)
PHE figures
Public Health England reports that the cumulative total of COVID (28) deaths in UK hospitals and care homes has risen by 4,272 in the last week to 75,024 while the rolling 7 day average rose from 522 on Christmas day to 610 (New Year data for Scotland to add).
Click to view the UK government Coronavirus Dashboard
In comparison averaged over recent years 1,700 people die daily from all causes.
In those districts where the COVID death rate is highest the storing of bodies in temporary mortuaries and some delay to funeral services cannot be ruled out between now and the end of February; this is most unlikely to be the case in Worcestershire where the COVID death rate is low.
ONS figures
The Office of National Statistics (ONS) separately reports registered deaths in England and Wales where COVID-19 is mentioned on the death certificate. The ONS figures lag the PHE figures by 10 - 14 days and do not include NI and Scotland, so are lower than the figures published by PHE.
The value of the ONS figures is that they are broken down by District so one can glimpse where deaths are occurring. The cumulative total of COVID related deaths in Worcestershire reported by the ONS up to 18th December (week 51) is shown below.
| Districts of Worcs | Deaths | Weekly increase | Population |
| Bromsgrove | 152 | +9 | 98,529 |
| Malvern Hills | 55 | +1 | 77,545 |
| Redditch | 96 | +10 | 85,317 |
| Worcester | 81 | +2 | 103,542 |
| Wychavon | 148 | +7 | 126,240 |
| Wyre Forest | 159 | +7 | 100,957 |
| TOTAL | 694 | +36 | 592,130 |
Cumulative COVID deaths registered by ONS to 18th December 2020
In the week ending 18th December, there were 36 COVID related deaths in Worcestershire, of which 10 were in a care home 25 in hospital and 1 elsewhere.
In total in England and Wales 3,241 COVID related deaths were reported by ONS in the week to 18th December, an increase of 265 (9%) on the week before. Of these 640 were in care homes, 162 at home, 38 in a hospice and 2,379 in hospital; plus 22 elsewhere.
The highest number of hospital deaths (>19) by Lower Tier Local Authority were in the North, Midlands, Lincolnshire, Kent and South Wales:
Stoke on Trent 29, Medway (Kent) 30, Cheshire East 24, Cheshire West 21; Barnsley 22, Doncaster 26, Rotherham 22, South Tyneside 20, Birmingham 45, Sandwell 22, Bradford 25, Leeds 24, Wakefield 29, Havering 34, Redbridge 20, Swansea 24, Cardiff 22, Rhonda Cynon Taf 30, Caerphilly 20, Hywel Dda University Health Board 20, Aneurin Bevan University Health Board 52, Cardiff and Vale University Health Board 26, Cwm Taf Morgannwg University Health Board 43, Swansea Bay University Health Board 43.
The cumulative total of all COVID related deaths recorded by the ONS for all weeks of the epidemic rose to 79,008 of which 20,503 were in care homes, 3,799 at home, 1,020 in a hospice and 53,122 in hospital; plus 614 elsewhere.
Click for national ONS data on deaths (Excel spreadsheet)
NHS England figures
More recently in the seven days ending 2nd January NHS England reported 21 deaths in Worcestershire hospitals compared to 10 last week (but note 14 deaths since added to previous weeks due to late reporting).
Click for NHS COVID-19 Daily Deaths
Healthcare numbers
The UK government Coronavirus Dashboard includes important information about COVID-19 patients currently in hospital.
| Hospital cases (UK) | Number | Weekly change |
| Patients in hospital | 23,823 | +2,537 |
| Patients on ventilation | 1,847 | +318 |
| Patients admitted daily | 2,434 | +291 |
Headline summary of patients in hospital as reported 3rd January 2021
Although these headline figures have not been updated recently they are useful indicators and show the trend in hospital admissions is still upwards, in line with the increase in COVID positive tests. Daily admissions now exceed the threshold of 2,000 above which hospitals may become overwhelmed.
Figures for bed occupancy in Worcestershire hospitals can be found on the NHS England website:
Click for NHS England COVID-19 Hospital Activity
Note: very sick COVID patients are said to arrive in hospital 7 to 10 days after first symptoms, and either die or are discharged 15 to 30 days after first symptoms in most cases. Hospital beds are occupied by suspected COVID patients, very sick COVID patients, and a few suffering from 'Long COVID' who may remain in hospital for much longer than 30 days.
Notes on projected figures
It appears hospitals are only admitting very sick COVID-19 patients, for example those with breathing difficulties, which is probably why Professor Peter Horby of Oxford University said on the Andrew Marr show that up to 20% of COVID patients in hospital could die.
It is our observation that the death rate as a percentage of daily hospital admissions has risen slightly to 24% since the middle of December.
If this is correct, the current admission rate of 2,434 new COVID patients per day points to up to 584 hospital deaths per day, to which must be added forecast COVID deaths in other settings such as care homes. Adding 30% for the latter suggests there could be about 760 deaths per day by the middle of January.
Statistician Sir David Spiegelhalter of Cambridge University speaking separately on BBC TV said that, using his rule of thumb, hospital admissions were likely to be about 10% of reported new cases, one week after symptoms; and deaths were likely to be about 2% of new cases, 2 to 3 weeks after that - which points towards 1,000 hospital deaths per day in the second half of January.
Since the end of the second lockdown the average daily death rate has roughly flat lined remaining above 400 deaths per day, while there has been a steady upturn in new daily cases. We attribute this to a third wave of the UK COVID epidemic which started on or about 1st December - resulting from relaxation of the lockdown restrictions, Christmas shopping, students returning home, households mixing over Christmas, and possibly 10% of people ignoring the controls.
Forecast for the week ahead
Trends suggest that during the next seven days (up to 10th January) the cumulative total of new UK COVID-19 cases reported by PHE on the Coronavirus Dashboard may increase by 438,000 cases towards 3,100,000 but the increase could be less if the government strengthens the restrictions.
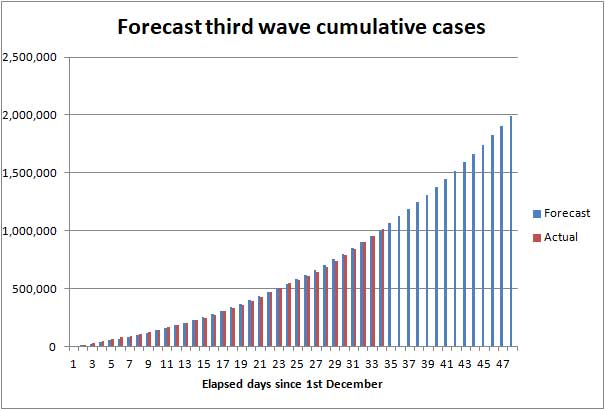
Illustration of possible rise in third wave cases to 17th January 2021
In Worcestershire up to 2,500 new cases of COVID-19 can be expected, and possibly up to 200 cases in the Malvern Hills district.
We estimate the number of COVID (28) deaths could increase by about 4,500 nationally towards 80,000 during the 7 days ending 10th January 2021.
In the county of Worcestershire, assuming a 2% death rate, the 2,242 new cases this week could translate to a maximum of 45 Worcestershire deaths per week in the second half of January, but if cases are mostly confined to younger age groups it could be less.
Longer term forecast
The third wave of the COVID-19 epidemic in the UK
For the purpose of simple analysis, we have assumed a third wave of the COVID-19 epidemic began on or about 1st December, as the second lockdown drew to a close, which could have been sparked by as few as 130,000 carriers (0.2% of the population); see chart above where the forecast is calculated as a truncated exponential series approximating to the rise in actual cases.
The tiered restrictions are obviously having some effect as otherwise cases would be rising very much faster, but more needs to be done - it's simple, people must stay further apart to slow transmission of the virus.
If the epidemic is to shrink the public must take physical distancing much more seriously, wear face masks, pay more attention to hand hygiene and self isolate if they feel unwell.
Reports in the media suggest people are tiring of the controls and hospital Intensive Care Units treating the sickest patients are being overwhelmed, so the government will almost certainly extend the restrictions in an attempt to return hospital admissions to below 2,000 per day and that ought to bring down the daily death rate, expressed as a 7 day rolling average, towards 500.
In the meantime, the cumulative UK COVID death toll will continue mounting in 2021 until the vaccination programme eventually brings the epidemic to a close. We now anticipate the death toll could reach 112,000 by the end of March 2021; see commentary.
Exactly what happens will depend on the effectiveness of the government's tiered restrictions, public compliance, the effectiveness of test and trace, any change in the lethality of emerging strains of the virus, and most importantly the speed of the vaccine rollout.
Vaccines
Approval of the Pfizer vaccine for use in the UK was announced on 2nd December and the first jabs were given in Coventry on 8th December. The government has ordered 40 million doses enough for 20 million people, but there has been no announcement about when the bulk of the vaccine will be delivered. About 944,000 first jabs were given in December.
The Astrazeneca vaccine was approved for use on 30th December and the first jabs could be given on 4th January. The PM said today on the Andrew Marr show that 530,000 doses were currently available, but that he could not comment further on the delivery schedule except that he hoped the vaccination programme would eventually build towards two million jabs per week. The BBC say 100 million doses have been ordered for delivery during 2021.
The original plan was for a second jab to be given 21 days after the first jab, but the government has decided to increase the gap to 12 weeks so that twice as many people can be inoculated in the next three months.
That suggests to us that the majority of 80+ year olds and key workers could now get the vaccine in January, with a progressive rollout to younger Seniors in February and March.
An article about the COVID-19 Vaccination Programme can be found on the British Medical Association website.
Another NHS article talks about the National Immunisation Management Service which seems to be a database for managing the vaccination programme.
NHS England is publishing a tally of the number of people vaccinated on an Excel spreadsheet, so you can monitor progress:-
Click for numbers of people vaccinated in England reported by NHS
A copy of TOTAL FIRST JABS also appears on the healthcare tab of the Coronavirus Dashboard.
Advice for Seniors
 Coronavirus
is soaring in South Wales and SE England, and daily cases are rising in
Worcestershire, so the risk remains HIGH
for Seniors living in the
Malvern Hills district; see our annex and riskometer opposite.
Coronavirus
is soaring in South Wales and SE England, and daily cases are rising in
Worcestershire, so the risk remains HIGH
for Seniors living in the
Malvern Hills district; see our annex and riskometer opposite.
If you are unlucky and catch COVID there is a significant chance that you will either die or your long term health may be seriously damaged, so take care to protect yourself and those you love. 90% of COVID deaths are in those aged over 60 years according to NHS England statistics.
So if you are offered a jab grasp the opportunity with both hands.
The simple safeguards to remember are still to:
-
wash your HANDS thoroughly, using soap and hot water, for 20 seconds, including after handling deliveries to your home, to kill virus picked up from contaminated surfaces see note 1;
-
wear a FACE mask when unavoidably near other people for example when shopping, visiting hospital or the chemist;
-
keep at least 2 metres apart from other individuals (SPACE) see note 2;
-
keep proximity as short as possible (TIME) see note 3;
-
self-isolate and book a test if you have COVID-19 symptoms (new continuous cough, fever or loss of, or change in, sense of smell or taste).
Hence the mantra:-
HANDS, FACE, SPACE, TIME - GET A TEST if you feel unwell.
Click for UK government Coronavirus guidance on what you can and cannot do
Remember, if you have symptoms of COVID-19 and can't count from one to ten out loud due to shortness of breath, you should immediately call your GP, 111 or 999 for advice.
Notes:
1) Wash your hands thoroughly before touching your face to avoid transferring virus from contaminated surfaces to your mouth, eyes and nose. If outdoors use hand gel.
2) Two metres is further than you think - roughly an arm and a walking stick away.
3) In tier 3 you should not mix with other households indoors.
Minimise exposure time if you unavoidably find yourself mixing in a confined setting - an invisible mist of virus can build up in the air if the space is shared with an infectious person; imagine people exhaling cigarette smoke. Unless you wear a well fitting FFP3 hospital grade face mask you can breath this in; a face covering will offer little or no protection. The likelihood and extent you get sick will depend on the density of the airborne virus, which can be reduced by ventilation, and the duration of your exposure.
Annex to 3rd January update
Commentary
Professor of Intensive Care Medicine, Hugh Montgomery, of London University spoke emotionally to Rachel Burden on the Radio 5 Live Breakfast programme about the tsunami of COVID cases hitting Intensive Care Units (ICUs) in London. He said many patients seemed to be doing well and then suddenly 'crumpled' after 7 - 10 days. In his experience most of those patients in ICU are now either young or middle aged as elderly COVID patients were likely to die before reaching ICU. Thus vaccinating the elderly was unlikely to reduce significantly the immediate pressure on Hospital ICUs although it would reduce deaths.
Prof Montgomery also spoke about hospitals being short staffed and consequently doctors and nurses being forced to work increasingly long shifts without holidays. He painted a picture of soaring cases of Coronavirus leading to a crisis in the NHS in January.
The surging infection rate is being blamed on a new variant of COVID-19 which is said to increase the Basic Reproduction Rate (Rb) by 0.4 to 0.7; though that is only a small increase on the old COVID-19 Basic Reproduction Rate of about 3 it makes a big difference when the tiered controls are struggling to keep the 'Effective' R below 1.
Click for Imperial College article New COVID-19 variant growing rapidly in England
The Imperial College article suggests the new variant of COVID has been more prevalent in those aged under 20 years. The explanation for this is presently not known so it would be unwise to jump to conclusions about spread in secondary schools.
Hugh Montgomery made the point that irrespective of the government's tiered restrictions, in the short term, the spread of the virus can only be slowed if people keep apart.
Some good news is that the Astrazeneca vaccine was approved on 30th December 2020 and the government has decided to increase the gap between first and second jabs from 21 days to 12 weeks in order to double the number of people vaccinated in the first three months of the year.
Click to read report in the Mail on Sunday
Changes to tiers
Because of the rapid spread of the third wave of the virus in some places, more districts were placed into TIER 4 (a lockdown in all but name) on 30th December. As expected Worcestershire has been moved to tier 3 due to rising daily cases.
Recent deaths in Worcestershire hospitals
The table below shows COVID deaths in Worcestershire Acute Hospitals Trust reported by NHS England in the 7 days to 2nd January.
| Date | Number |
| 27th December | 5 |
| 28th December | 4 |
| 29th December | 3 |
| 30th December | 6 |
| 31st December | 0 |
| 1st January | 0 |
| 2nd January | 0 |
| Total | 18 |
Worcester Acute Trust hospitals COVID deaths in 7 days to 2nd January 2020
In addition there were 3 deaths in Worcester 'Care' hospitals making a total of 21 deaths recorded so far (note: the figures are liable to update as gathering data can take several days).
To date a cumulative total of 446 COVID deaths have been reported in Worcester Acute hospitals and 42 in 'Care' hospitals, which makes the actual increase in deaths since last week 35.
Present rate of new cases
This week, the average rate of infection per 100,000 population per week in England rose from 392 to 476. In comparison the figure for Worcestershire is 287 and that in the Malvern Hills 189; the rural Malvern Hills remains the safest district in Worcestershire.
As a guide one might expect the infection rate to be no more than 50 cases per 100,000 per week at this point of the epidemic; so it is hugely disappointing that, after 10 months of management by the government, the national infection rate is nine times higher.
Seniors should continue to be careful.
The probability of catching Coronavirus in the Malvern Hills is approaching HIGH, and combined with the significant risk of death makes us view the overall risk to Seniors, prior to inoculation, as approaching VERY HIGH.
The risk of death from Coronavirus for healthy teenagers is exceedingly small so for them the risk is LOW, whereas the middle aged can suffer from Long COVID so for them the risk might be assessed MODERATE.
Forecast of death rate during January and beyond
Deaths in the first half of January are 'baked in' as they will relate to people already infected - during this period the average daily death rate can be expected to creep up from 500 towards 700 deaths per day; possibly in the worst case heading towards 1,000 deaths per day in the second half of January.
Further government controls and the rollout of vaccines could begin to reduce the death rate from February onwards.
As mentioned last week, a projection of the future COVID-19 death toll and daily deaths can be found on The Institute for Health Metrics and Evaluation website.
Click for IHME projection of COVID-19 deaths
The IHME forecast suggests that the death toll in the UK from COVID in all settings could be heading towards 116,000 by the end of March 2021, when the epidemic might be tailing off, and the death rate falling below 100 deaths per day. We currently think that projection is 'not unreasonable'. Assuming the death rate conservatively averages 500 deaths per day until towards the end of January and then falls linearly to 1st April, a back of the envelope calculation suggests about 37,500 more deaths can be expected which when added to the present cumulative total implies the UK death toll, on the basis recorded by PHE, could reach 112,000 if not more by the end of March 2021. Bearing in mind the ONS figures which record all deaths where COVID is mentioned on the death certificate are higher, then these estimates are in the same 'ball park'.
At the start of the epidemic in March the Chief Scientific Adviser, Sir Patrick Valance, suggested a death toll of 20,000 would be a good outcome; on the other hand, Professor Neil Ferguson of Imperial College warned in some scenarios the death toll might be as high as 250,000; while we thought, in the very worst case assuming up to 1% of the UK population died the outcome might have been nearer 400,000 taking into account some build up of herd immunity.
So how well will the UK have done? When Sir Patrick Valance spoke off the top of his head there had been few deaths and he clearly did not want to 'scare the horses'. Professor Neil Ferguson was nearest the mark. A few might consider an outcome of the order of 112,000 deaths a fair result compared to a greater number of people dying in a very short space of time, more being permanently disabled by Long COVID, and temporary collapse of the NHS. Members of the Labour Party will no doubt say the UK has done poorly compared to the best performing countries such as Singapore where deaths have been much lower, not to mention the enormous expense of supporting those out of work and huge damage to the economy.
Ultimately there can be no winners or losers, but there must be a meaningful inquiry to learn lessons for the future.
Summary of Links
Symptoms
Article about the effects of Coronavirus on the human body
Reporting and how to obtain a test
How to get a test
https://www.nhs.uk/coronavirus
About joining the Zoe COVID Symptom Study:
Guidance
UK government Coronavirus guidance
Tiers
Guidance on tiers: what you need to know
Government postcode checker to find tier for other areas
Statistics
UK government Coronavirus Dashboard
Coronavirus Dashboard Interactive Map
ONS data on deaths in England and Wales (Excel spreadsheet)
NHS England COVID-19 Daily Deaths
NHS England COVID-19 Hospital Admissions
NHS England vaccination statistics
Reports
ONS Coronavirus (COVID-19) Roundup
The bigger picture
Worldometer summary of coronavirus cases worldwide
European Centre for Disease Prevention and Control info
https://www.ecdc.europa.eu/en/geographical-distribution-2019-ncov-cases
World Health Organisation info
Window on the USA
Centre for Disease Control (CDC)
American Association of Retired People (AARP)
Worcestershire
Help:
http://www.worcestershire.gov.uk/here2help
Worcestershire County Council COVID-19 information:
http://www.worcestershire.gov.uk/coronavirus
Here you will find a useful link,
'Website: Number of new cases by date in Worcestershire'
which displays interesting COVID charts and statistics for Worcestershire
Miscellaneous
Spanish Flu
Dr Jeff Kildea's commentary about the 1919 outbreak of Spanish Flu in Australia
Views of Martin McKee, Professor of European Public Health
Follow Martin McKee on Twitter
SAGE membership
Scientific Advisory Group for Emergencies (SAGE)
Scottish government:
Link to Scottish Government website
Link to Postcode checker for COVID restrictions by protection level in areas of Scotland
Welsh Government:
Guidance on COVID alert levels in Wales
![]()
The interpretations and opinions expressed are our own
Last updated 5th January 2021