Angus and Rosemary's Miscellany
of Malvern - Other Resources
|
Coronavirus (COVID-19) epidemic weekly update for Malvern SeniorsCOVID LOCKDOWN in ENGLAND Alert Level raised to 5 on January 4th INFECTION RATE HIGH PM says 'STAY AT HOME' Skip to menu of archived pages PreambleWe keep an eye on the published government figures to asses the level of risk in the Malvern Hills district, if there is an uptick in cases we will tell you. This page is updated every Sunday between 1800 and 2400 hours GMT. Information about Coronavirus can be found on the NHS website: https://www.nhs.uk/coronavirus
|
 How
to request a test
How
to request a test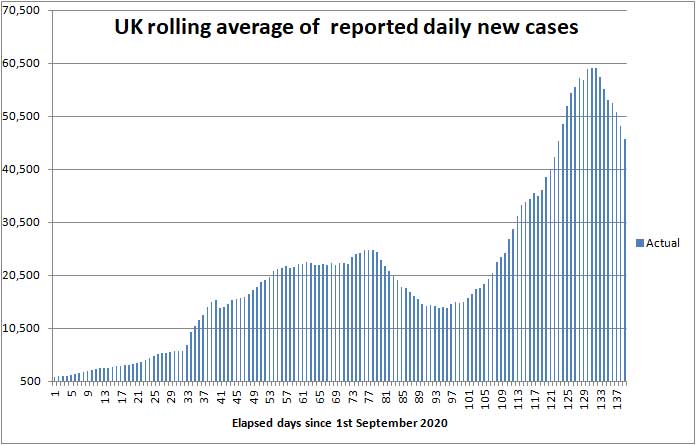
| Districts of Worcs | Cases | Weekly increase | Population |
| Bromsgrove | 4,816 | +560 | 98,529 |
| Malvern Hills | 1,888 | +275 | 77,545 |
| Redditch | 4,042 | +610 | 85,317 |
| Worcester | 4,257 | +735 | 103,542 |
| Wychavon | 4,357 | +701 | 126,240 |
| Wyre Forest | 3,939 | +451 | 100,957 |
| TOTAL | 23,287 | +3,338 | 592,130 |
| COMPARE WITH | |||
| County of Hereford | 5,149 | +654 | 195,000 |
| Leicester (city of) | 26,925 | +1,942 | 400,000 |
Cumulative cases reported by PHE in Worcestershire to 17th January 2021
Interactive map
At the bottom of the Coronavirus Dashboard (daily update) page there is an Interactive Map which is coloured to show the variation in infection rate across the country. The purple patches show the areas of highest infection are beginning to shrink slightly.
Click for Interactive Map of COVID cases
Note: the Interactive Map works on desktop PCs but it's possible you may encounter difficulties using a tablet or smartphone.
Recent weekly cases to 12th January are: North Malvern 35; Malvern Link 33; Pickersleigh 13; Barnards Green 13; Malvern Wells and Priory 32; Callow End and Hanley 27; Upton and Welland 23. The picture changes daily.
Number of deaths
Statistics on COVID deaths are published by Public Health England, The Office of National Statistics, and NHS England.
PHE figures
Public Health England reports that the cumulative total of COVID (28) deaths in UK hospitals and care homes has risen by 7,812 in the last week to 89,243 while the daily average has risen slightly from 915 to 1,116; see chart below.
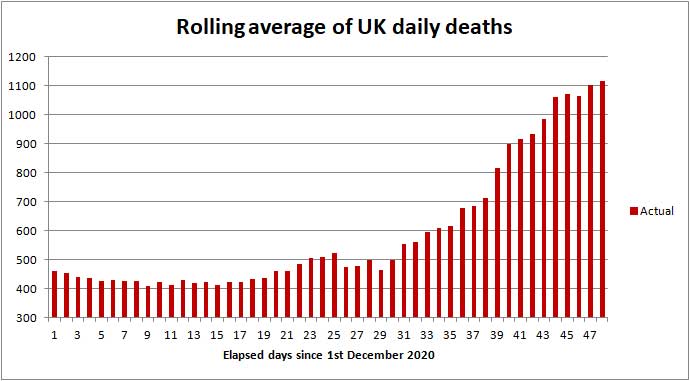
Daily UK death rate from 1st Dec to 17th Jan 2021 (source PHE)
Click to view the UK government Coronavirus Dashboard
In comparison averaged over recent years 1,700 people die daily from all causes.
In those districts where the COVID death rate is highest the storing of bodies in temporary mortuaries and delay to funeral services can be expected between now and the end of February.
ONS figures
The Office of National Statistics (ONS) separately reports registered deaths in England and Wales where COVID-19 is mentioned on the death certificate. The ONS figures lag the PHE figures by 10 - 14 days and do not include NI and Scotland, so are lower than the figures published by PHE.
The value of the ONS figures is that they are broken down by District so one can glimpse where deaths are occurring. The cumulative total of COVID related deaths in Worcestershire reported by the ONS up to 1st January 2021 (week 53) is shown below.
| Districts of Worcs | Deaths | Weekly increase | Population |
| Bromsgrove | 164 | +7 | 98,529 |
| Malvern Hills | 61 | +3 | 77,545 |
| Redditch | 108 | +7 | 85,317 |
| Worcester | 87 | +2 | 103,542 |
| Wychavon | 157 | +5 | 126,240 |
| Wyre Forest | 171 | +8 | 100,957 |
| TOTAL | 748 | +32 | 592,130 |
Cumulative COVID deaths registered by ONS to 1st January 2021
In the week ending 1st January, there were 32 COVID related deaths in Worcestershire, of which 6 were in a care home, 2 at home, and 24 in hospital.
In total in England and Wales 3,451 COVID related deaths were reported by ONS in the week to 1st January, an increase of 264 (8%) on the week before. Of these 602 were in care homes, 171 at home, 25 in a hospice and 2,610 in hospital; plus 23 elsewhere.
The highest number of hospital deaths (>19) by Lower Tier Local Authority were in London, Birmingham and South Wales:
Stoke on Trent 27, Medway (Kent) 25, County Durham 24, Barnsley 21, Sheffield 20, Sunderland 21, Birmingham 32, Hillingdon 24 (London), Hounslow (London) 21, Newham (London) 35, Redbridge (London) 27, Waltham Forest (London) 21, Swansea 26, Bridgend 22, Cardiff 20, Rhondda Cynon Taf 34, Hywel Dda University Health Board 31, Aneurin Bevan University Health Board 57, Cardiff and Vale University Health Board 29, Cwm Taf Morgannwg University Health Board 66, Swansea Bay University Health Board 44.
The cumulative total of all COVID related deaths recorded by the ONS for all weeks of the epidemic rose to 85,686 of which 21,673 were in care homes; 4,118 at home; 1,101 in a hospice; 58,132 in hospital; and 662 elsewhere.
Click for national ONS data on deaths (Excel spreadsheet)
NHS England figures
More recently in the seven days ending 16th January NHS England reported the cumulative total of deaths in Worcestershire hospitals rose by 72 to 589.
Click for NHS COVID-19 Daily Deaths
Healthcare numbers
The UK government Coronavirus Dashboard includes important information about COVID-19 patients currently in hospital.
| Hospital cases (UK) | Number | Weekly change |
| Patients in hospital | 37,475 | +5,181 |
| Patients on ventilation | 3,798 | +691 |
| Patients admitted daily | 4,179 | +113 |
Headline summary of patients in hospital as reported 17th January 2021
These headline figures show the number of COVID patients has gone up a bit but flat-lined in the last few days; the number of patients on ventilators is higher than in the first wave; and daily admissions still greatly exceed the threshold of 2,000 above which hospitals are placed under pressure.
Figures for bed occupancy in Worcestershire hospitals can be found on the NHS England website:
Click for NHS England COVID-19 Hospital Activity
On 12th January there were 232 COVID patients occupying beds in Worcestershire Acute Hospitals at Worcester, Kidderminster and Redditch (an increase of 30% on last week), and a further 36 in 'care' hospitals. In England a total of 32,202 beds were occupied.
Note: The Welsh First Minister said some time ago that very sick COVID patients arrive in hospital 7 to 10 days after first symptoms, and either die or are discharged 15 to 30 days after first symptoms in most cases. Hospital beds are occupied by suspected COVID patients, very sick COVID patients, and a few suffering from 'Long COVID' who may remain in hospital for much longer than 30 days.
Notes on projected figures
It appears hospitals are only admitting very sick COVID-19 patients, for example those with breathing difficulties, which is probably why Professor Peter Horby of Oxford University said on the Andrew Marr show that up to 20% of COVID patients in hospital could die.
It is our observation that the death rate as a percentage of daily hospital admissions has risen in the last ten days. Possibly this is because hospitals are now only accepting extremely sick patients and nurses have less time to give to each patient; or it maybe something to do with delayed reporting of the statistics. Whatever the reason, this week we are unable to forecast future deaths from hospital admissions
Statistician Sir David Spiegelhalter of Cambridge University speaking separately on BBC TV said that, using his rule of thumb, hospital admissions were likely to be about 10% of reported new cases, one week after symptoms; and deaths were likely to be about 2% of new cases, 2 to 3 weeks after that - which points towards 925 hospital deaths per day in the first week of February.
Forecast for the week ahead
The chart below shows how the number of COVID positive tests has been increasing since 1st December (in red) and forecast (in blue) following announcement of the lockdown. The latest forecast assumes a logistic curve with daily new cases peaking about 8th January.
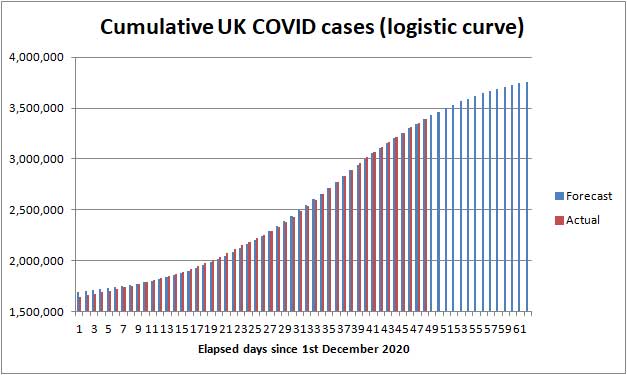
Illustration of possible rise in cases to 31st January 2021
Trends suggest that during the next seven days (up to 24th January) the cumulative total of new UK COVID-19 cases reported by PHE on the Coronavirus Dashboard could increase by about 275,000 towards 3,650,000.
In Worcestershire up to 3,300 new cases of COVID-19 can be expected, and possibly up to 270 cases in the Malvern Hills district.
We estimate the number of COVID (28) deaths could increase by about 8,300 nationally towards 96,000 during the 7 days ending 24th January 2021.
In the county of Worcestershire, assuming a 2.4% death rate, the 3,338 new cases this week could translate to about 80 Worcestershire deaths per week towards the end of January, but if cases are mostly confined to younger age groups it could be less.
Longer term forecast
The third wave of the COVID-19 epidemic in the UK
For the purpose of simple analysis, it has been assumed that a third wave of the COVID-19 epidemic began on or about 1st December, as the second lockdown drew to a close; see the new chart above where the logistic curve starts exponentially, reaches its half way point on the 5th January and then slows down to mimic the effect of the third lockdown.
Following the lockdown in England announced on 4th January, the daily rate of new cases of COVID has fallen from 59,653 to 46,230.
Those infected on the 4th January will have fallen sick about 11th January and the sickest of those will be admitted to hospital about now. Of those admitted broadly 24% will die before the end of January. That taken with the high daily COVID admission rate of about 4,000 patients per day suggests the lockdown will do very little to dampen demand for hospital beds during the remainder of January.
We anticipate the seven day rolling average of the COVID daily death rate will peak somewhere between 1,200 and 1,400 deaths per day towards the end of January, possibly even higher on some days if hospitals are briefly overwhelmed and doctors forced to choose who to save.
The death rate should fall in February as the effect of the lockdown and vaccinations begin to bear down on the virus.
Meanwhile the death toll will continue to mount until the Vaccination Programme eventually draws the COVID-19 epidemic to a close. Currently we expect the UK COVID death toll to approach 120,000 by the end of March 2021; see commentary.
Exactly what happens will depend on the public's compliance with the lockdown, the effectiveness of test and trace, any change in the lethality of emerging strains of the virus, and most importantly the speed of the vaccine rollout.
Vaccines
The elderly are now being invited for vaccination in Malvern Town, so look out for a telephone call or text message from your surgery, or a letter from the NHS. We anticipate that the majority of 80+ year olds and key workers will get the vaccine in January, with a progressive rollout to younger Seniors in February, and March at the latest.
NHS England will be publishing a tally of the number of people vaccinated on an Excel spreadsheet, so you can monitor progress:-
Click for numbers of people vaccinated in England reported by NHS
A copy of TOTAL FIRST JABS also appears on the Coronavirus Dashboard which currently shows 3,857,266 first jabs.
Advice for Seniors
 The daily
number of new cases of Coronavirus is high and we judge the
risk approaching
VERY HIGH for Seniors living in the
Malvern Hills district; see our annex and riskometer opposite.
The daily
number of new cases of Coronavirus is high and we judge the
risk approaching
VERY HIGH for Seniors living in the
Malvern Hills district; see our annex and riskometer opposite.
If you are unlucky and catch COVID there is a significant chance that you will either die or your long term health may be seriously damaged, so take care to protect yourself and those you love. 90% of COVID deaths are in those aged over 60 years according to NHS England statistics.
So if you are offered a jab grasp the opportunity with both hands.
The simple safeguards to remember are still to:
-
wash your HANDS thoroughly, using soap and hot water, for 20 seconds, including after handling deliveries to your home, to kill virus picked up from contaminated surfaces see note 1;
-
wear a FACE mask when unavoidably near other people for example when shopping, visiting hospital or the chemist;
-
SPACE at least 2 metres apart from others see note 2;
-
keep TIME near others as short as possible, see note 3;
-
self-isolate and book a test if you have COVID-19 symptoms (new continuous cough, fever or loss of, or change in, sense of smell or taste).
Hence the mantra:-
HANDS, FACE, SPACE, TIME - GET A TEST if you feel unwell.
Click for UK government Coronavirus guidance on what you can and cannot do
Remember, if you have symptoms of COVID-19 and can't count from one to ten out loud due to shortness of breath, you should immediately call your GP, 111 or 999 for advice.
Notes:
1) Wash your hands thoroughly before touching your face to avoid transferring virus from contaminated surfaces to your mouth, eyes and nose. If outdoors use hand gel.
2) Two metres is further than you think - roughly an arm and a walking stick away.
3) During the National Lockdown you should not mix with other households.
Minimise exposure time if you unavoidably find yourself mixing in a confined setting - an invisible mist of virus can build up in the air if the space is shared with an infectious person; imagine people exhaling cigarette smoke. Unless you wear a well fitting FFP3 hospital grade face mask you can breath this in; a face covering will offer little or no protection. The likelihood and extent you get sick will depend on the density of the airborne virus, which can be reduced by ventilation, and the duration of your exposure.
Annex to 17th January update
Commentary
Speculation in the media this week has been about whether the government will meet its target of vaccinating all over 70 year olds by the middle of February and whether the lockdown measures should be strengthened.
On Monday Matt Hancock gave a press briefing about the UK COVID-19 Vaccines Delivery Plan.
Click for press release on government plan
The government target is broadly to vaccinate those aged 70 and above by the middle of February, those aged 50 and above by the Spring, and those aged 18 and above by the Autumn.
(In the Sunday Telegraph there is speculation over whether all this can be achieved by the end of June).
Masks
On Monday the supermarket chains Morrisons and Sainsbury said they would be denying entry to those not wearing face masks. About time too; in our view both the managers of shops not enforcing the wearing of masks and ditto the police have been grossly negligent in not enforcing compliance thereby contributing to the spread of COVID-19 over the last six months.
In England, mandatory wearing of face masks on public transport was introduced on 15th June and in shops on 24th July. Shopworkers too have had to wear face masks since 24th September, unless behind a perspex screen.
Click for guidance on face coverings
A re-tweet by Professor Martin McKee points to a report about the efficacy of wearing face masks. The report mentions Wu Lien Teh’s work to control the 1910 Manchurian Plague acclaimed as 'a milestone in the systematic practice of epidemiological principles in disease control', in which Wu identified the cloth mask as 'the principal means of personal protection.' So when during the first wave of the epidemic the government experts said there was little evidence of face masks being of value it would appear they had forgotten that valuable lesson, unlike those in Japan and South Korea.
The report suggests an empirical formula for the reduction of the Reproduction Rate (R) by wearing a face mask:
Multiplier = (1-mp)2
Where m is the fraction of virus particles removed by the face mask, and p is the proportion of people wearing face masks.
Example: so if simple face coverings were to remove 30% of virus particles and 70% of people wore face coverings the multiplier would be approximately 0.6 so a basic R of 3 might be reduced to 1.8; seen as part of a layered approach the wearing of face masks would therefore seem an important 'weapon'.
On Tuesday Home Secretary Pritti Patel gave a press conference stressing the need for people to obey the rules and saying that the police would move from Engage, Encourage and Explain to stricter enforcement of the rules and issuing fines to rule breakers.
The rules in England do not specify a limit on how far one can travel for exercise; this has engaged the media and barrister Chris Daw QC who on Nicky Campbell's Radio 5 Live breakfast show attacked the government for not setting a limit.
On Wednesday Nicola Sturgeon tightened the lockdown controls in Scotland, and there was discussion in the media about the new variants of COVID in England, South Africa and Brazil. Labour MPs asked why there were not tighter controls on travel from Brazil.
On Thursday Chris Smith speaking on Radio 5 mentioned the SIREN study had found those infected by COVID-19 generally had at least five months immunity from getting it again.
Click for article in Nature about SIREN study
Later in the day a 'ban' was announced on travellers from South America, Portugal and Cape Verde.
Click for BBC report on travel ban
On Friday the PM gave a press conference exhorting people to continue following the rules, and giving an update on the vaccine rollout. Closure of 'restriction free' travel corridors was announced - from 4:00 am on Monday travellers will need to produce a certificate of a negative COVID-19 test in the 3 days prior to flying, and self isolate for 10 days on arrival. Flights from South Africa are currently banned to keep out the new variant of COVID there.
Some commentators have suggested travellers should be forced to quarantine in government hotels and pay £1,000 for the privilege, as in New Zealand.
Pfizer announced the delivery of COVID vaccines to the EU could be delayed slightly due to upgrade of its factory in Belgium to enable higher production.
Click for BBC report on vaccine delay
The media featured interviews with hospital doctors who all said hospitals were in crisis. Although the peak of the epidemic was expected to be reached within the next 10 days, hospitals would remain under pressure until the number of daily new cases fell significantly.
Overloaded hospitals were already transferring patients to nearby hospitals and in a few cases patients had been taken from London to hospitals as far away as Newcastle.
TV showed reporters visiting COVID-19 wards in London hospitals and extremely upsetting footage of desperately ill COVID patients near death's door.
On Saturday Professor John Edmunds speaking on Radio 4 hinted the third lockdown is unlikely to end before April, and that when the lockdown does end phased controls would be needed, until the majority of the population had been vaccinated, in order to contain daily hospital admissions.
Vaccinations
Vaccination of the those aged 80+ has been taking place at our surgery. We were told the NHS informs the surgery when vaccine is coming and provides a list of those eligible to be vaccinated. The surgery then calls people in.
On Thursday Superdrug said they would be participating in a pilot programme of vaccinations at pharmacies in 6 stores. Those eligible would be sent a letter by the NHS, which would have to be presented at the store.
Recent deaths in Worcestershire hospitals
The table below shows COVID deaths in Worcester hospitals reported by NHS England in the 7 days to 16th January.
| Worcestershire | Cumulative deaths | Weekly increase | |
| Acute hospitals | 543 | +70 | |
| Care hospitals | 46 | +2 | |
| TOTAL | 589 | +72 |
The high number of deaths is in proportion to the surge in daily cases during January and possibly the consequence of Christmas festivities.
Present rate of new cases
This week, the average rate of infection per 100,000 population per week in England fell slightly from 651 to 578. In comparison the figure for Worcestershire is 534 and that in the Malvern Hills 274.
As a guide one might expect the infection rate to be no more than 50 cases per 100,000 per week at this point of the epidemic; so it is hugely disappointing that, after 10 months of management by the government, the national infection rate is almost twelve times higher.
Seniors need to be jolly careful.
The probability of catching Coronavirus in the Malvern Hills is close to HIGH, and combined with the significant risk of death makes us view the overall risk to Seniors, prior to inoculation, as approaching VERY HIGH.
The risk of death from Coronavirus for healthy teenagers is exceedingly small so for them the risk is LOW, whereas the middle aged can suffer from Long COVID so for them the risk might be assessed MODERATE.
Forecast of death rate during January and beyond
Deaths during the remainder of January are 'baked in' - relating to people already infected. We envisage the average death rate will peak at somewhere between 1,200 and 1,400 deaths per day, but would not be surprised if the death rate was briefly slightly higher due to hospitals operating at maximum capacity and nurses either off sick or isolating.
The lockdown and rollout of vaccines should begin to reduce the death rate steadily from early February onwards.
Despite this, the pressure on hospitals is unlikely to reduce much until the daily number of new cases and daily hospital admissions fall.
Assuming the death rate averages 1,000 deaths per day during January and then falls linearly to the middle of March, a back of the envelope calculation suggests the UK death toll, on the basis recorded by PHE, could reach 120,000 towards the end of March 2021.
Another projection of the future COVID-19 death toll and daily deaths can be found on The Institute for Health Metrics and Evaluation website:
Click for IHME projection of COVID-19 deaths
At the start of the epidemic in March the Chief Scientific Adviser, Sir Patrick Valance, suggested a death toll of 20,000 would be a good outcome; on the other hand, Professor Neil Ferguson of Imperial College warned in some scenarios the death toll might be as high as 250,000; while we thought, in the very worst case assuming up to 1% of the UK population died the outcome might have been nearer 400,000 taking into account some build up of herd immunity.
So how well will the UK have done? When Sir Patrick Valance spoke off the top of his head there had been few deaths and he clearly did not want to 'scare the horses'. Professor Neil Ferguson was nearest the mark. A few might consider an outcome of the order of 120,000 deaths a fair result compared to a greater number of people dying in a very short space of time, more being permanently disabled by Long COVID, and temporary collapse of the NHS. Members of the Labour Party and others will no doubt say the UK has done poorly compared to the best performing countries such as Australia, New Zealand and Singapore where deaths have been much lower, not to mention the enormous expense of supporting those out of work and huge damage to the economy.
Ultimately there can be no winners or losers, but there must eventually be a thorough inquiry to learn lessons for the future.
Summary of Links
Symptoms
Article about the effects of Coronavirus on the human body
Reporting and how to obtain a test
How to get a test
https://www.nhs.uk/coronavirus
About joining the Zoe COVID Symptom Study:
Guidance
UK government Coronavirus guidance
Tiers
Guidance on tiers: what you need to know
Government postcode checker to find tier for other areas
Statistics
UK government Coronavirus Dashboard
Coronavirus Dashboard Interactive Map
ONS data on deaths in England and Wales (Excel spreadsheet)
NHS England COVID-19 Daily Deaths
NHS England COVID-19 Hospital Admissions
NHS England vaccination statistics
Reports
ONS Coronavirus (COVID-19) Roundup
The bigger picture
Worldometer summary of coronavirus cases worldwide
European Centre for Disease Prevention and Control info
https://www.ecdc.europa.eu/en/geographical-distribution-2019-ncov-cases
World Health Organisation info
Window on the USA
Centre for Disease Control (CDC)
American Association of Retired People (AARP)
Worcestershire
Help:
http://www.worcestershire.gov.uk/here2help
Worcestershire County Council COVID-19 information:
http://www.worcestershire.gov.uk/coronavirus
Here you will find a useful link,
'Website: Number of new cases by date in Worcestershire'
which displays interesting COVID charts and statistics for Worcestershire
Miscellaneous
Spanish Flu
Dr Jeff Kildea's commentary about the 1919 outbreak of Spanish Flu in Australia
Views of Martin McKee, Professor of European Public Health
Follow Martin McKee on Twitter
SAGE membership
Scientific Advisory Group for Emergencies (SAGE)
Scottish government:
Link to Scottish Government website
Link to Postcode checker for COVID restrictions by protection level in areas of Scotland
Welsh Government:
Guidance on COVID alert levels in Wales
![]()
The interpretations and opinions expressed are our own
Last updated 17th January 2021