Angus and Rosemary's Miscellany
of Malvern - Other Resources
|
Coronavirus (COVID-19) epidemic weekly update for Malvern SeniorsCOVID LOCKDOWN in ENGLAND Alert Level raised to 5 on January 4th INFECTION RATE HIGH PM says 'STAY AT HOME' Skip to menu of archived pages PreambleWe keep an eye on the published government figures to asses the level of risk in the Malvern Hills district, if there is an uptick in cases we will tell you. This page is updated every Sunday between 1800 and 2400 hours GMT. Information about Coronavirus can be found on the NHS website: https://www.nhs.uk/coronavirus
|
 How
to request a test
How
to request a test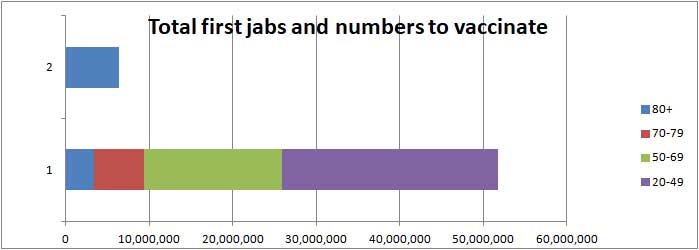
| Districts of Worcs | Cases | Weekly increase | Population |
| Bromsgrove | 5,235 | +419 | 98,529 |
| Malvern Hills | 2,104 | +216 | 77,545 |
| Redditch | 4,595 | +553 | 85,317 |
| Worcester | 4,804 | +547 | 103,542 |
| Wychavon | 4,864 | +517 | 126,240 |
| Wyre Forest | 4,271 | +334 | 100,957 |
| TOTAL | 25,873 | +2,586 | 592,130 |
| COMPARE WITH | |||
| County of Hereford | 5,677 | +528 | 195,000 |
| Leicester (city of) | 28,948 | +2,204 | 400,000 |
Cumulative cases reported by PHE in Worcestershire to 24th January 2021
Daily cases fell slightly in Worcestershire, but flat-lined in Leicester.
Interactive map
At the bottom of the Coronavirus Dashboard (daily update) page there is an Interactive Map which is coloured to show the variation in infection rate across the country. The purple patches show the areas of highest infection are beginning to recede.
Click for Interactive Map of COVID cases
Note: the Interactive Map works on desktop PCs but it's possible you may encounter difficulties using a tablet or smartphone.
Recent weekly cases to 19th January are: North Malvern 19; Malvern Link 20; Pickersleigh 16; Barnards Green 20; Malvern Wells and Priory 15; Callow End and Hanley 24; Upton and Welland 15. The picture changes daily.
Number of deaths
Statistics on COVID deaths are published by Public Health England, The Office of National Statistics, and NHS England.
PHE figures
Public Health England reports that the cumulative total of COVID (28) deaths in UK hospitals and care homes has risen by 8,696 in the last week to 97,939 while the daily average has risen slightly from 1,116 to 1,242; see chart below.
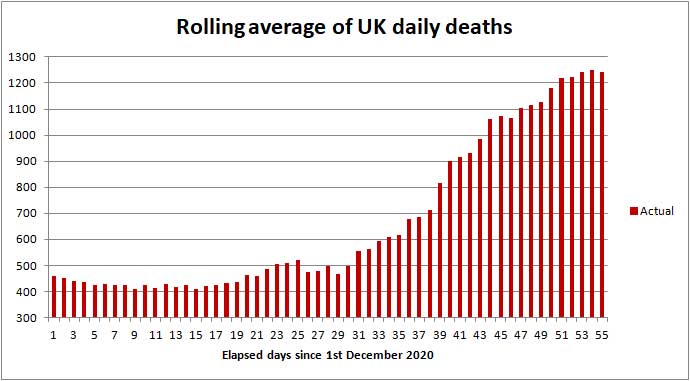
Daily UK death rate from 1st Dec to 24th Jan 2021 (source PHE)
It looks as though the death rate may have reached a peak and could begin to fall in the next fortnight.
Click to view the UK government Coronavirus Dashboard
In comparison averaged over recent years 1,700 people die daily from all causes.
In those districts where the COVID death rate is highest the storing of bodies in temporary mortuaries and delay to funeral services can be expected between now and the end of February.
ONS figures
The Office of National Statistics (ONS) separately reports registered deaths in England and Wales where COVID-19 is mentioned on the death certificate. The ONS figures lag the PHE figures by 10 - 14 days and do not include NI and Scotland, so are lower than the figures published by PHE.
The value of the ONS figures is that they are broken down by District so one can glimpse where deaths are occurring. The cumulative total of COVID related deaths in Worcestershire reported by the ONS up to 8th January 2021 (week 1 of 2021)) is shown below.
| Districts of Worcs | Deaths | Weekly increase | Population |
| Bromsgrove | 175 | +11 | 98,529 |
| Malvern Hills | 70 | +9 | 77,545 |
| Redditch | 116 | +8 | 85,317 |
| Worcester | 103 | +16 | 103,542 |
| Wychavon | 166 | +9 | 126,240 |
| Wyre Forest | 181 | +10 | 100,957 |
| TOTAL | 811 | +63 | 592,130 |
Cumulative COVID deaths registered by ONS to 8th January 2021
In the week ending 8th January, there were 63 COVID related deaths in Worcestershire, of which 11 were in care homes, 3 at home, and 46 in hospital.
In total in England and Wales 6,505 COVID related deaths were reported by ONS in the week to 8th January, a large increase of 3,054 (88%) on the week before. Of these 1,027 were in care homes, 311 at home, 73 in a hospice and 5,043 in hospital; plus 51 elsewhere.
The 3,054 uplift in deaths reflects the cost of Christmas related activities with further deaths to add next week.
The highest number of hospital deaths (>29) by Lower Tier Local Authority were:
Southend on Sea 44, Thurrock 30, Medway (Kent) 56, County Durham 37, Cheshire West 35, Central Bedfordshire 43, Buckinghamshire, Basildon 34, Swale 30, Barnsley 2, Doncaster 44, Sheffield 38, Birmingham 89, Barking and Dagenham 40, Barnet 50, Bexley 31, Brent 31, Bromley 32, Havering 63, Newham 38, Redbridge 57, Tower Hamlets 32, Waltham Forest 44, Carmarthenshire 31, Bridgend 31, Cardiff 47, Rhondda Cynon Taf 42, Caerphilly 33, Hywel Dda University Health Board 51, Aneurin Bevan University Health Board 86, Cardiff and Vale University Health Board 62, Cwm Taf Morgannwg University Health Board 90, Swansea Bay University Health Board 45.
The cumulative total of COVID related deaths recorded by the ONS for all weeks of the epidemic rose to 92,191.
Click for national ONS data on deaths (Excel spreadsheet)
NHS England figures
More recently in the seven days ending 23rd January NHS England reported the cumulative total of deaths in Worcestershire hospitals rose by 66 to 655.
Click for NHS COVID-19 Daily Deaths
Healthcare numbers
The UK government Coronavirus Dashboard includes important information about healthcare statistics.
| Hospital cases (UK) | Number | Weekly change |
| Patients currently in hospital | 37,899 | +424 |
| Patients on ventilation | 4,076 | +287 |
| Patients admitted daily | 4,013 | -166 |
Headline summary of patients in hospital as reported 24th January 2021
These headline figures show the number of COVID patients in hospital has roughly flat-lined in the last few days but what we need to see is the number steadily falling as hospitals are having difficulty coping.
The number of patients on ventilators has risen and is now 30% greater than in the first wave; this is very bad news as the outcome for patients on ventilators is poor.
Daily admissions have roughly flat-lined but the number still greatly exceeds the threshold of 2,000 above which hospitals are placed under pressure.
Figures for bed occupancy in Worcestershire hospitals can be found on the NHS England website:
Click for NHS England COVID-19 Hospital Activity
On 19th January there were 239 COVID patients occupying beds in Worcestershire Acute Hospitals at Worcester, Kidderminster and Redditch (an increase of 3% on last week), and a further 36 in 'care' hospitals. In England a total of 34,105 COVID beds were occupied an increase of 6% on last week.
Note: The Welsh First Minister said some time ago that very sick COVID patients arrive in hospital 7 to 10 days after first symptoms, and either die or are discharged 15 to 30 days after first symptoms in most cases. Hospital beds are occupied by suspected COVID patients, very sick COVID patients, and a few suffering from 'Long COVID' who may remain in hospital for much longer than 30 days.
Notes on projected figures
It appears hospitals are only admitting very sick COVID-19 patients, for example those with breathing difficulties, which is probably why Professor Peter Horby of Oxford University said on the Andrew Marr show that up to 20% of COVID patients in hospital could die.
It is our observation that the death rate as a percentage of daily hospital admissions has been higher than expected during the last 2 to 3 weeks. The reason for this is unexplained, but the shape of the curve suggests the daily death rate has reached a peak so should begin to fall within the next fortnight.
Statistician Sir David Spiegelhalter of Cambridge University speaking separately on BBC TV said that, using his rule of thumb, hospital admissions were likely to be about 10% of reported new cases, one week after symptoms; and deaths were likely to be about 2% of new cases, 2 to 3 weeks after that - which would point to about 800 hospital deaths per day towards the middle of February.
Forecast for the week ahead
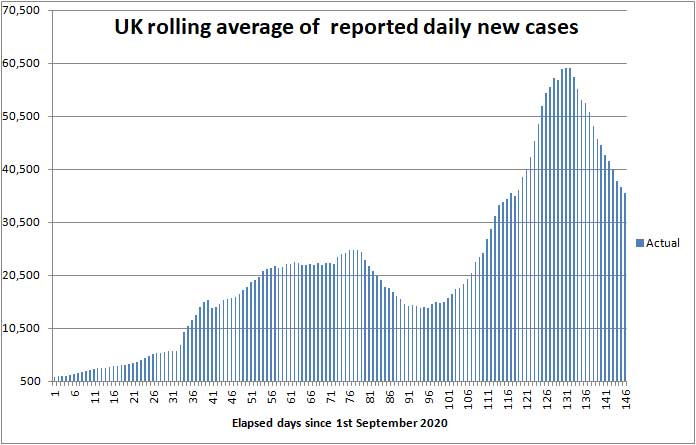
The chart below shows how the number of COVID positive tests has been increasing since 1st December (in red) and forecast (in blue) to the end of January. The forecast is based on a logistic curve with daily new cases peaking about 8th January.
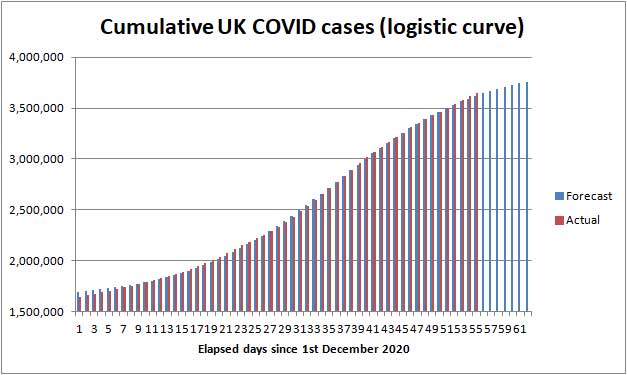
Illustration of possible rise in cases to 31st January 2021
Trends suggest that during the next seven days (up to 31st January) the cumulative total of new UK COVID-19 cases reported by PHE on the Coronavirus Dashboard could increase by about 200,000 towards 3,850,000 a tad above the blue curve.
In Worcestershire up to 2,600 new cases of COVID-19 can be expected, and possibly up to 200 cases in the Malvern Hills district.
We estimate the number of COVID (28) deaths could increase by about 8,000 nationally towards 106,000 during the 7 days ending 31st January 2021.
In the county of Worcestershire, assuming a 2.4% death rate, the 2,586 new cases this week could translate to about 62 Worcestershire deaths per week in the first half of February, but if cases are mostly confined to younger age groups it could be less.
Longer term forecast
The third wave of the COVID-19 epidemic in the UK
For the purpose of simple analysis, it has been assumed that a third wave of the COVID-19 epidemic began on or about 1st December, as the second lockdown drew to a close; see the new chart above where the logistic curve starts exponentially, reaches its half way point on the 5th January and then slows down to mimic the effect of the third lockdown.
Daily new cases of Coronavirus are falling steadily, while the average daily death rate appears to be peaking at about 1,200 deaths per day and should begin falling in February as the effect of the lockdown and vaccinations begin to bear down on the virus.
Meanwhile the death toll will continue to mount until the Vaccination Programme eventually draws the COVID-19 epidemic to a close. We now think the UK COVID death toll could approach 130,000 by the end of March 2021; see commentary.
Exactly what happens will depend on the public's compliance with the lockdown, the effectiveness of test and trace, any change in the lethality of emerging strains of the virus, and most importantly the speed of the vaccine rollout.
Advice for Seniors
 The daily
number of new cases of Coronavirus is still unacceptably high and we judge the
risk approaching
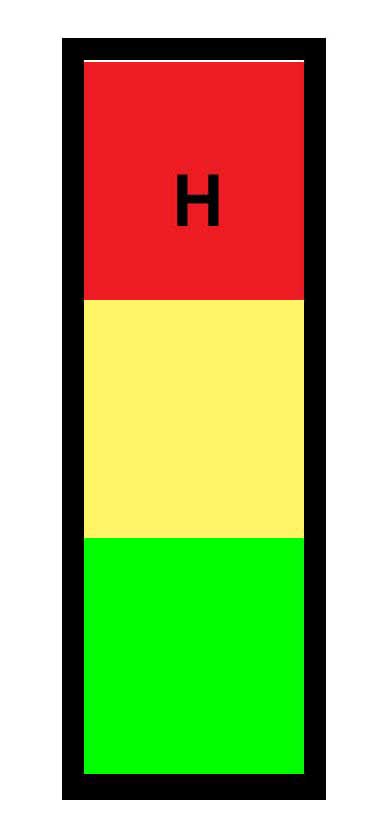
VERY HIGH for Seniors living in the
Malvern Hills district; see our annex and riskometer opposite.
The daily
number of new cases of Coronavirus is still unacceptably high and we judge the
risk approaching
VERY HIGH for Seniors living in the
Malvern Hills district; see our annex and riskometer opposite.
If you are unlucky and catch COVID there is a significant chance that you will either die or your long term health may be seriously damaged, so take care to protect yourself and those you love. 90% of COVID deaths are in those aged over 60 years according to NHS England statistics.
So if you are offered a jab grasp the opportunity with both hands.
The simple safeguards to remember are still to:
-
wash your HANDS thoroughly, using soap and hot water, for 20 seconds, including after handling deliveries to your home, to kill virus picked up from contaminated surfaces see note 1;
-
wear a FACE mask when unavoidably near other people for example when shopping, visiting hospital or the chemist;
-
SPACE at least 2 metres apart from others see note 2;
-
keep TIME near others as short as possible, see note 3;
-
self-isolate and book a test if you have COVID-19 symptoms (new continuous cough, fever or loss of, or change in, sense of smell or taste).
Hence the mantra:-
HANDS, FACE, SPACE, TIME - GET A TEST if you feel unwell.
Pulse Oximeter
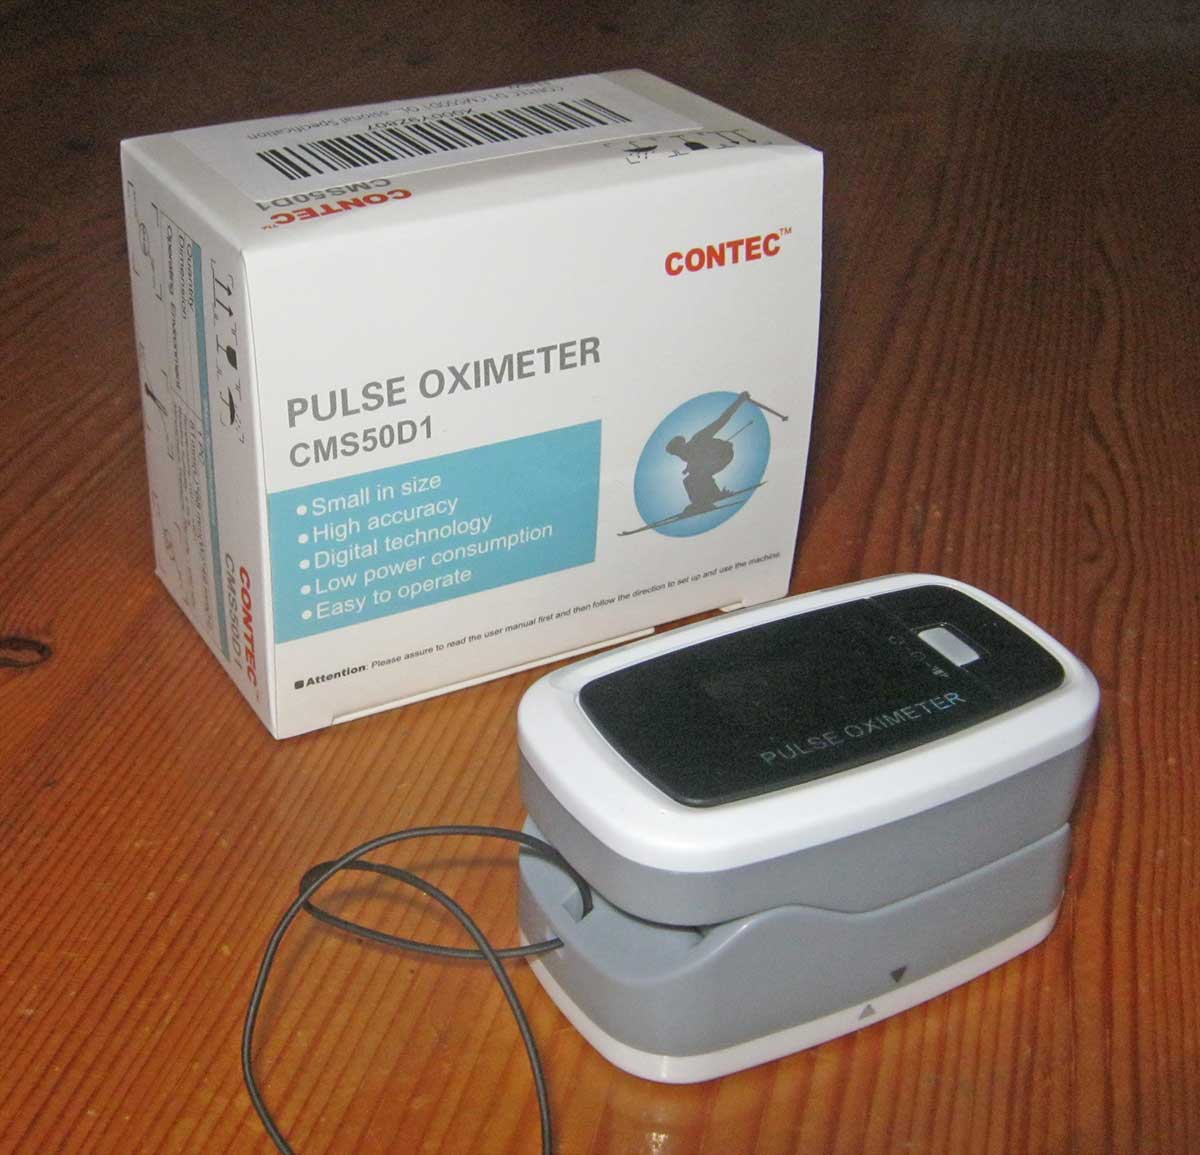 A
doctor in Bournemouth speaking on the evening news on Thursday suggested
that if you were sick with COVID at home it would be a good idea to have a
little device known as a Pulse Oximeter handy (see photo on right). This
measures the oxygen saturation in the blood and pulse rate by clipping the
device on a finger and pressing a button; the reading should normally be at
least 97%.
A
doctor in Bournemouth speaking on the evening news on Thursday suggested
that if you were sick with COVID at home it would be a good idea to have a
little device known as a Pulse Oximeter handy (see photo on right). This
measures the oxygen saturation in the blood and pulse rate by clipping the
device on a finger and pressing a button; the reading should normally be at
least 97%.
If the reading falls to about 93% you should call your doctor for advice, and if the reading drops below 92% you should consider calling an ambulance or visiting A&E.
Pulse Oximeters can be purchased from Amazon for £18 to £25; alternatively your doctor's surgery might loan you one if you are unwell and have tested COVID positive.
Remember, if you have symptoms of COVID-19 at home and can't count from one to ten out loud due to shortness of breath, you should immediately call your GP, 111 or 999 for advice.
Click for UK government Coronavirus guidance on what you can and cannot do
Notes:
1) Wash your hands thoroughly before touching your face to avoid transferring virus from contaminated surfaces to your mouth, eyes and nose. If outdoors use hand gel.
2) Two metres is further than you think - roughly an arm and a walking stick away.
3) During the National Lockdown you should not mix with other households.
Minimise exposure time if you unavoidably find yourself mixing in a confined setting - an invisible mist of virus can build up in the air if the space is shared with an infectious person; imagine people exhaling cigarette smoke. Unless you wear a well fitting FFP3 hospital grade face mask you can breath this in; a face covering will offer little or no protection. The likelihood and extent you get sick will depend on the density of the airborne virus, which can be reduced by ventilation, and the duration of your exposure.
Annex to 24th January update
Commentary
On Monday 18th January the government gave permission for vaccination of those aged 70+.
Click for press release: COVID-19 vaccines rolled out to people aged 70 years and over from today
At teatime Matt Hancock gave a COVID press briefing; there appeared little new to report.
On Tuesday 19th Jan the Worcester News reported an outbreak of COVID-19 at the Blossom House care home at the top of Avenue Road. Two residents had died and ten residents and seven staff had tested COVID positive. At another care home on the outskirts of Malvern a small outbreak had been successfully contained.
On Wednesday the daily number of deaths reported was 1,800 the highest since the start of the epidemic; however the seven day rolling average remained about 1,200.
On Thursday Pritti Patel, the Home Secretary gave the No 10 press briefing, with emphasis on obeying the rules. The penalty for attending 'House Parties' has been raised to £800, doubling for further offences to a maximum of £6,400. In answer to questions, Pritti Patel said it was too soon to think about booking summer holidays abroad. Dr Chris Smith answered listeners' question on late night Radio 5.
On Friday numerous commentators were invited by the media to express their views on how the COVID outbreak should be handled. These included Professor Martin McKee, Nick Forbes leader of Newcastle City Council, and Helen Michie, Professor of Health Psychology at UCL.
Martin McKeen seemed to be of the view a stricter lockdown was needed to bring new cases of COVID down to a level where find, test, trace, isolate and support would keep the virus under control. He thought backward tracing to find the source of infection and then working forwards to find other contacts was best done by local Public Health (shoe leather epidemiology as he termed it), and more support was needed to help poorer members of the community self isolate.
Nick Forbes was angry because having vaccinated the elderly in care homes and 70% of those aged 80+ vaccine was being withheld from GP surgeries in Newcastle and Gateshead while other regions caught up.
Helen Michie supported a universal payment of £500 to all who self isolate, which it seems the government does not.
The Malvern Gazette reported a COVID outbreak at the Perry Manor Care home near Worcester Royal Hospital. In recent weeks 15 residents had died and 33 staff had tested COVID positive.
The BBC reported a large wedding party at the Jewish Yesodey Hatora Girls' school in Stamford Hill attended by 400 guests in breach of COVID regulations. The previous principal of the school had died of COVID during the first wave.
Click for BBC report on wedding party broken up by police
The Prime Minister held a press briefing at 5 pm on Friday with Dr Chris Witty and Sir Patrick Valance.
Click for Prime Minister's statement
Click to watch PM's briefing on Youtube
Currently 1 in 55 people are thought to have the virus rising to 1 in 35 in London.
There was some evidence the new English variant of COVD-19 had a higher mortality perhaps increasing the risk of death for 60 year olds from 10 to 13 or 14 deaths per 1000 of new cases, but in hospital mortality amongst patients appeared the same.
Chris Witty said daily hospital admissions and deaths appeared to be flattening out.
There was concern the South African variant of the virus might have some resistance to the vaccine, which was being investigated. If necessary border controls would need to be tightened.
Vaccination
As of 21st January there were large variations in the percentage of those vaccinated aged 80+ years across the country according to the Health Service Journal (HSJ). Hereford and Worcester are near the top of the league at 76%. Gloucestershire is at the top (85%) while Suffolk and North East Essex are at the bottom (36%).
Roughly half the doses administered so far have been to those aged 80+ and we assume the remainder have been to frontline health and care staff.
Recent deaths in Worcestershire hospitals
The table below shows COVID deaths in Worcester hospitals reported by NHS England in the 7 days to 23rd January.
| Worcestershire | Cumulative deaths | Weekly increase | |
| Acute hospitals | 607 | +64 | |
| Care hospitals | 48 | +2 | |
| TOTAL | 655 | +66 |
Present rate of new cases
This week, the average rate of infection per 100,000 population per week in England fell slightly from 578 to 437. In comparison the figure for Worcestershire is 483 and that in the Malvern Hills 265.
As a guide we would expect the third lockdown to continue until the infection rate falls below 50 cases per 100,000 per week.
In the meantime seniors need to continue to be jolly careful.
The probability of catching Coronavirus in the Malvern Hills is close to HIGH, and combined with the significant risk of death makes us view the overall risk to Seniors, prior to inoculation, as approaching VERY HIGH.
The risk of death from Coronavirus for healthy teenagers is exceedingly small so for them the risk is LOW, whereas the middle aged can suffer from Long COVID so for them the risk might be assessed MODERATE.
Forecast of death rate during February and March
The average daily death rate appears to have peaked at 1,200 deaths per day, so the UK COVID-19 death toll looks set to reach 106,000 by the end of January, exceeding the milestone of 100,000 deaths.
Within the next fortnight the lockdown and rollout of vaccines should begin to reduce the daily death rate, leading to a steady drop during February, with deaths possibly tailing off to about 100 deaths per day during March.
Assuming the daily death rate is 1,200 at the beginning of February and falls to 200 by the end of February as a result of the vaccination of over 70 year olds, then the average will be 700 deaths per day leading to 19,600 additional deaths in February.
Then assuming the death rate falls further to 100 deaths per day by the end of March as a result of the vaccination of over 60 year olds, the average could be 150 deaths per day in March leading to 4,650 additional deaths.
Adding these 'back of the envelope' numbers suggests the UK COVID-19 death toll could reach 130,250 by the end of March.
| Date | Forecast UK COVID-19 death toll |
| January 31st | 106,000 |
| February 28th | +19,600 |
| March 31st | +4,650 |
| Total | 130,250 |
Forecast UK COVID-19 epidemic death toll
Another projection of the future COVID-19 death toll and daily deaths can be found on The Institute for Health Metrics and Evaluation website:
Click for IHME projection of COVID-19 deaths
Last month the UK projection was for 116,000 COVID deaths but in the last few days it has been updated to 123,000.
At the start of the epidemic in March the Chief Scientific Adviser, Sir Patrick Valance, suggested a death toll of 20,000 would be a good outcome; on the other hand, Professor Neil Ferguson of Imperial College warned in some scenarios the death toll might be as high as 250,000; while we thought, in the very worst case assuming up to 1% of the UK population died the outcome might have been nearer 400,000 taking into account some build up of herd immunity.
So how well will the UK have done? When Sir Patrick Valance spoke off the top of his head there had been few deaths and he clearly did not want to 'scare the horses'. Professor Neil Ferguson was nearest the mark. A few might consider an outcome of 130,000 deaths a fair result compared to a greater number of people dying in a very short space of time, more being permanently disabled by Long COVID, and temporary collapse of the NHS. Members of the Labour Party and others will no doubt say the UK has done very poorly compared to the best performing countries such as Australia, New Zealand and Singapore where deaths have been much lower, not to mention the enormous expense of supporting those out of work and huge damage to the economy.
Ultimately there can be no winners or losers, but there must eventually be a thorough inquiry to learn lessons for the future.
Pressure on hospitals
The pressure on hospital beds will not fall until the daily number of COVID hospital admissions drops from 4,000 towards 2,000 patients per day and that in turn will depend on the daily number of new cases falling below 20,000. We anticipate a slackening of the pressure on the NHS before the end of February.
Summary of Links
Symptoms
Article about the effects of Coronavirus on the human body
Reporting and how to obtain a test
How to get a test
https://www.nhs.uk/coronavirus
About joining the Zoe COVID Symptom Study:
Guidance
UK government Coronavirus guidance
Tiers
Guidance on tiers: what you need to know
Government postcode checker to find tier for other areas
Statistics
UK government Coronavirus Dashboard
Coronavirus Dashboard Interactive Map
ONS data on deaths in England and Wales (Excel spreadsheet)
NHS England COVID-19 Daily Deaths
NHS England COVID-19 Hospital Admissions
NHS England vaccination statistics
Reports
ONS Coronavirus (COVID-19) Roundup
The bigger picture
Worldometer summary of coronavirus cases worldwide
European Centre for Disease Prevention and Control info
https://www.ecdc.europa.eu/en/geographical-distribution-2019-ncov-cases
World Health Organisation info
Window on the USA
Centre for Disease Control (CDC)
American Association of Retired People (AARP)
Worcestershire
Help:
http://www.worcestershire.gov.uk/here2help
Worcestershire County Council COVID-19 information:
http://www.worcestershire.gov.uk/coronavirus
Here you will find a useful link,
'Website: Number of new cases by date in Worcestershire'
which displays interesting COVID charts and statistics for Worcestershire
Miscellaneous
Spanish Flu
Dr Jeff Kildea's commentary about the 1919 outbreak of Spanish Flu in Australia
Views of Martin McKee, Professor of European Public Health
Follow Martin McKee on Twitter
SAGE membership
Scientific Advisory Group for Emergencies (SAGE)
Scottish government:
Link to Scottish Government website
Link to Postcode checker for COVID restrictions by protection level in areas of Scotland
Welsh Government:
Guidance on COVID alert levels in Wales
![]()
The interpretations and opinions expressed are our own
Last updated 25th January 2021