Angus and Rosemary's Miscellany
of Malvern - Other Resources
|
Coronavirus (COVID-19) epidemic weekly update for Malvern Seniors28th March 2021 COVID LOCKDOWN in ENGLAND EXIT STEP 1B, CASES FLAT-LINING Skip to menu of archived pages PreambleWe keep an eye on the published government figures and monitor the media to asses the level of risk for Seniors in the Malvern Hills district. This page is currently updated every Sunday between 1800 and 2400 hours GMT. Information about Coronavirus can be found on the NHS website: https://www.nhs.uk/coronavirus
|
 How
to request a COVID test (updated)
How
to request a COVID test (updated)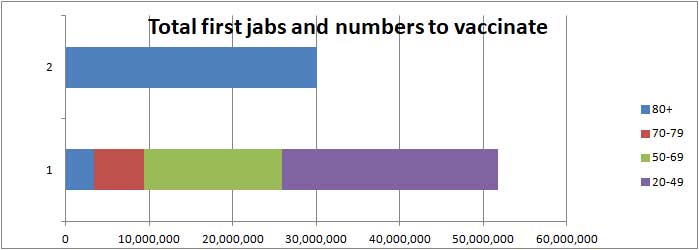
| Districts of Worcs | Cases | Weekly increase | Population |
| Bromsgrove | 6,201 | +56 | 98,529 |
| Malvern Hills | 2,751 | +15 | 77,545 |
| Redditch | 6,188 | +83 | 85,317 |
| Worcester | 6,010 | +44 | 103,542 |
| Wychavon | 6,356 | +51 | 126,240 |
| Wyre Forest | 5,433 | +49 | 100,957 |
| TOTAL | 32,988 | +298 | 592,130 |
| COMPARE WITH | |||
| County of Hereford | 6,852 | +48 | 195,000 |
| Leicester (city of) | 35,615 | +397 | 400,000 |
Cumulative cases reported by PHE in Worcestershire to 28th March 2021
Interactive map
At the bottom of the Coronavirus Dashboard (daily update) page there is an Interactive Map which is coloured to show the variation in infection rate across the country. The light green areas show how the rate of infection has fallen steadily across the UK since the start of the third lockdown.
Click for Interactive Map of COVID cases
Note: the Interactive Map works on desktop PCs but it's possible you may encounter difficulties using a tablet or smartphone.
Cases in Malvern have been falling steadily - weekly cases to 23rd March are: North Malvern <3; Malvern Link <3; Pickersleigh <3; Barnards Green <3; Malvern Wells and Priory 5; Callow End and Hanley <3; Upton and Welland <3. The picture changes daily; it only takes one person to start a flare up.
Number of deaths
Statistics on COVID deaths are published by Public Health England, The Office of National Statistics, and NHS England; the daily death rate continues to fall steadily.
PHE figures
Public Health England reports that the cumulative total of COVID (28) deaths in UK hospitals and care homes has risen by 437 in the last week to 126,592 while the daily average has fallen from 91 to 62; see chart below which shows the actual daily death rate in red, and our forecast to 16th April in blue.
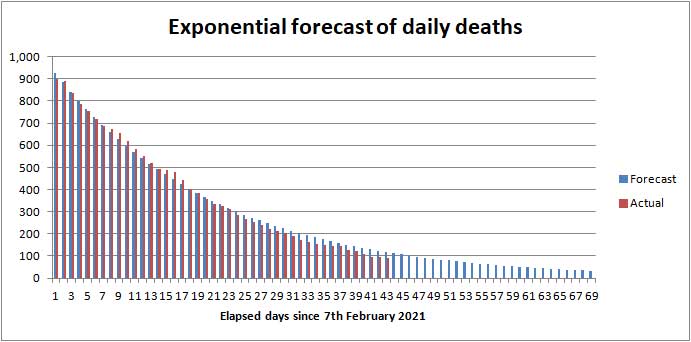
Daily UK death rate from 7th February to 28th March 2021 in red
Forecast to 16th April in blue
The forecast is based on an exponential function multiplied by a factor to take account of vaccinations.
Click to view the UK government Coronavirus Dashboard
In comparison averaged over recent years 1,700 people die daily from all causes.
ONS figures
The Office of National Statistics (ONS) separately reports registered deaths in England and Wales where COVID-19 is mentioned on the death certificate. The ONS figures lag the PHE figures by 10 - 14 days and do not include NI and Scotland.
The ONS figures are broken down by District providing a glimpse of where deaths are occurring. The provisional cumulative total of COVID related deaths in Worcestershire reported by the ONS up to 12th March 2021 (week 10 of 2021) is shown below.
| Districts of Worcs | Deaths 2020 |
Deaths 2021 |
Week 10 only (provisional) |
Population |
| Bromsgrove | 164 | 96 | 3 | 98,529 |
| Malvern Hills | 61 | 80 | 0 | 77,545 |
| Redditch | 108 | 78 | 2 | 85,317 |
| Worcester | 87 | 109 | 1 | 103,542 |
| Wychavon | 157 | 113 | 4 | 126,240 |
| Wyre Forest | 171 | 35 | 5 | 100,957 |
| TOTAL | 748 | 571 | 15 | 592,130 |
Provisional cumulative COVID deaths registered by ONS to 12th March 2021
Note: the ONS weekly death figures provide provisional counts of the number of deaths registered in England and Wales for which data are available. Numbers will rise as more death registrations are received. Consequently great care has to be exercised comparing one week's figures with another.
For example last week (week 9) 534 cumulative deaths were recorded in Worcestershire in 2021, and this week (week 10) 571 suggesting there had been a weekly increase of 37 deaths. However the arrival of late figures has updated the week 9 total to 556 so the increase this week (week 10) is reported as just 15 so far - but that figure will in turn increase due to late reports dribbling in.
In England and Wales 1,564 COVID related deaths have been reported by the ONS in the week to 12th March so far. Of these 256 were in a care home, 138 at home, 31 in a hospice, 1,127 in hospital and 12 elsewhere.
The highest number of hospital deaths (>19) by Lower Tier Local Authority were:
Birmingham 27, and Betsi Cadwaladr University Health Board 21.
The provisional COVID death toll for all weeks of the epidemic is shown in the following table for England and Wales. (The UK total is about 10% higher as deaths for Scotland and Northern Ireland have to be added).
| Year | Provisional cumulative COVID related deaths in England and Wales |
| 2020 | 85,686 |
| 2021 | 56,416 |
| TOTAL | 142,102 |
COVID death toll in England and Wales to 12th March 2021 (source: ONS)
Click for national ONS data on deaths (Excel spreadsheet)
NHS England figures
More recently in the seven days ending 27th March NHS England reported the cumulative total of deaths in Worcestershire hospitals rose by just 4 to 860.
Click for NHS COVID-19 Daily Deaths
Healthcare numbers
The UK government Coronavirus Dashboard includes important information about healthcare statistics.
| Hospital cases (UK) | Number | Weekly change |
| Patients currently in hospital | 4,560 | -1,602 |
| Patients on ventilation | 615 | -215 |
| Patients admitted daily | 343 | -94 |
Headline summary of patients in hospital as reported 28th March 2021
These headline figures show the number of COVID patients in hospital has continued to fall and is now 11% of the peak.
Daily admissions are continuing to fall slowly. In the past the steady state number of COVID patients in hospital has been roughly ten time the number of patients admitted daily, suggesting a fall to 3,400 patients is on the way.
Tabulated figures for bed occupancy in Worcestershire Acute and Care hospitals can be found on the NHS England website, but it is quicker to look at a graph at the bottom of the Worcestershire Coronavirus Dashboard homepage which shows at a glance the number of beds occupied by COVID patients in Worcestershire Acute hospitals.
Click for Worcestershire Coronavirus Dashboard
Click for NHS England COVID-19 Hospital bed Activity
Notes on projected figures for deaths
Statistician Sir David Spiegelhalter of Cambridge University speaking on BBC TV last year said that, using his rule of thumb, hospital admissions were likely to be about 10% of reported new cases, one week after symptoms; and deaths were likely to be about 2% of new cases, 2 to 3 weeks after that - which would point to no more than 100 deaths per day in UK hospitals by the second week in April. COVID deaths as a percentage of new cases are already beginning to fall to very roughly 1% of new cases as a result of vaccination so a figure of 50 deaths per day is more likely.
Forecast for the week ahead
Trends suggest that during the next seven days (up to 4th April) the cumulative total of new UK COVID-19 cases reported by PHE on the Coronavirus Dashboard could increase by about 40,000 towards 4,374,000.
In Worcestershire up to 300 new cases of COVID-19 can be expected, and possibly up to 20 cases in the Malvern Hills district.
We estimate the number of COVID (28) deaths could increase by about 370 nationally towards 126,970 during the 7 days ending 4th April 2021.
In the county of Worcestershire, assuming a 1% death rate, the 298 new cases this week should translate to no more than 3 Worcestershire deaths per week by mid April.
Longer term forecast
It is once again impossible to provide a long term forecast this week due to uncertainty about how much the relaxation of government restrictions and the behaviour of the public will put up the Effective Reproduction Rate of the virus, and how effective the vaccines will be at reducing the transmission of COVID-19. The best we can do is speculate about what might happen.
This week the effective Reproduction Rate of the virus is reported on the Coronavirus Dashboard between 0.7 and 0.9 suggesting rapid rollout of the vaccine, frequent testing of school children and their families, hand washing, masks, and physical distancing has been largely keeping COVID under control during STEP 1A of the exit from lockdown.
The picture varies across the country - the Zoe study reports cases have either flat-lined or started creeping up in parts of Wales, Scotland and the Midlands, while cases have been falling in London and the South. Infections are now mainly in those aged under 50 including teenagers.
Boris Johnson has signalled the government will proceed to STEP 1B on 29th March which permits either two households, or groups of up to 6 people to meet outdoors while keeping 2 metres apart - this could put up the COVID-19 Reproduction Rate, especially if people start disobeying the rules now the weather is improving.
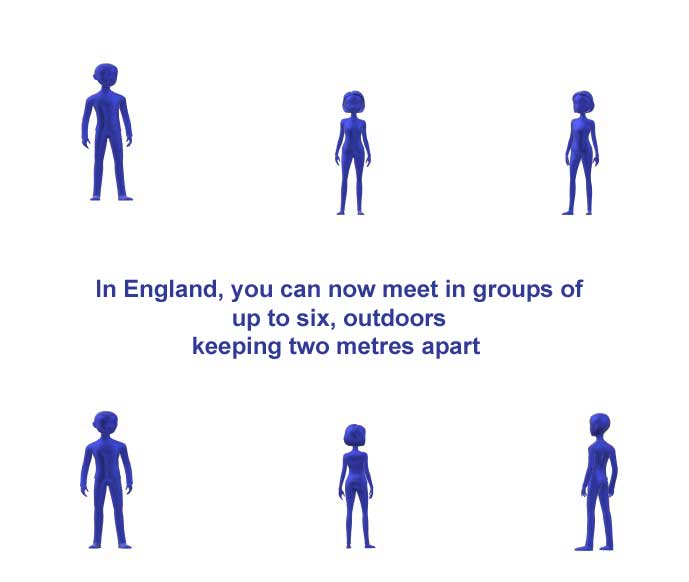
COVID rule of six
Just over half the adult population has been vaccinated with one jab. Now we have seen no official estimate of the basic reproduction rate of the Kent virus, but were it to be as high as 5, vaccination alone would only reduce the Effective Reproduction Rate to 2.5 and so the wearing of masks and physical distancing beyond April may still be needed, possibly up to and beyond the ending of the third lockdown in June.
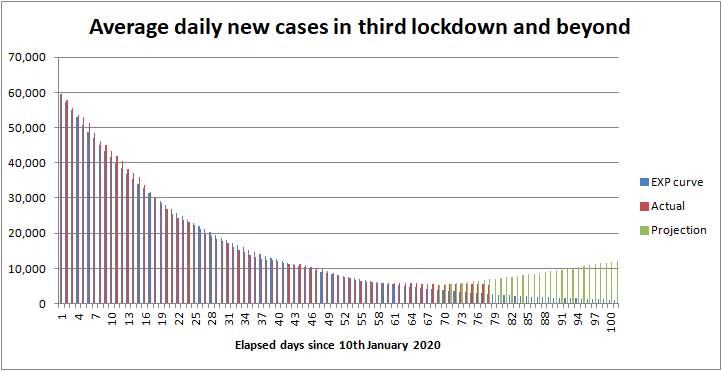
Projected new daily cases to 20th April 2021
The chart above shows the number of daily new cases in red and a falling exponential curve which was our forecast more than a month ago in blue, (assuming R<1).
The green projection is an illustration of what might happen if R rises a little above one causing daily cases to start rising at a rate half that of the third wave. An adjustment has been made for vaccination, including take up of the vaccine (85% allowing for those under 18), and effectiveness (80%). Based on these assumptions you will see towards the end of April new daily cases could either fall to 1,000 a day in the very best case (R<1), or rise towards 12,000 (R>1).
By next Sunday 4th April the chart suggests the average number of daily new cases could lie in the range 2,000 to 8,000. In the last ten days cases have roughly flat-lined at about 5,500 and we are guessing that number is going to start rising.
Consequently we have chosen to apply a weighted average 60% in favour of districts rising, and 40% of districts falling next week giving a projection of 5,800 new cases per day by next Sunday - it will be interesting to see what actually happens.
If the vaccine breaks the link with hospitalizations and deaths then the level of daily cases should be of no great concern, providing cases do not spiral out of control.
The death toll will continue to mount until the vaccination programme eventually draws the UK COVID-19 epidemic to a close. We still expect the UK COVID death toll to reach 128,000 by the end of April 2021; see commentary. This estimate has changed little over the last month.
Advice for Seniors
 The
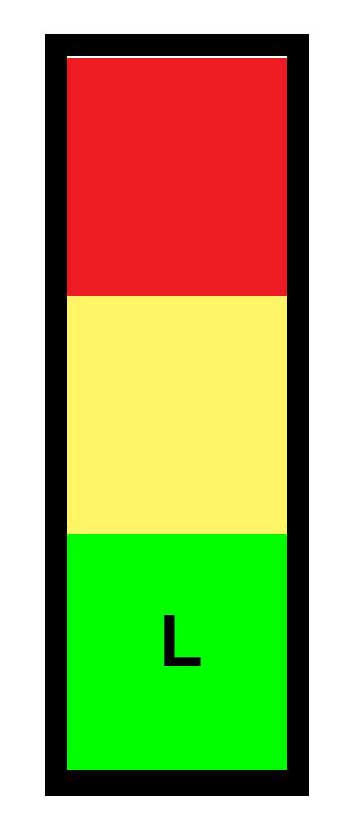
daily number of new cases of Coronavirus has fallen a long way from
the peak so we judge the risk to be approaching LOW for most Seniors
in the Malvern Hills district who have been vaccinated more than 3 weeks ago;
see our annex and riskometer opposite.
The
daily number of new cases of Coronavirus has fallen a long way from
the peak so we judge the risk to be approaching LOW for most Seniors
in the Malvern Hills district who have been vaccinated more than 3 weeks ago;
see our annex and riskometer opposite.
But remember, if you are elderly, have not been vaccinated, and catch COVID there is a significant chance that you will either die or your long term health may be seriously damaged, so continue to take care to protect yourself and those you love. 90% of COVID deaths are in those aged over 60 years according to NHS England statistics.
Click for our risk of death table (for those who have not been vaccinated)
It's possible, despite a first jab, for up to 20% of Seniors to become ill with COVID, though not seriously in most cases, so it makes sense to continue taking reasonable precautions until the epidemic fizzles out.
The simple safeguards to remember are to:
-
wash your HANDS thoroughly, using soap and hot water, for 20 seconds, including after handling deliveries to your home, to kill virus picked up from contaminated surfaces see note 1;
-
wear a FACE mask when unavoidably near other people for example when shopping, visiting hospital or the chemist;
-
SPACE at least 2 metres apart from others see note 2;
-
keep TIME near others as short as possible, see note 3;
-
self-isolate and book a test if you have COVID-19 symptoms (new continuous cough, fever or loss of, or change in, sense of smell or taste).
Hence the mantra:-
HANDS, FACE, SPACE, TIME - GET A TEST if you feel unwell.
Pulse Oximeter
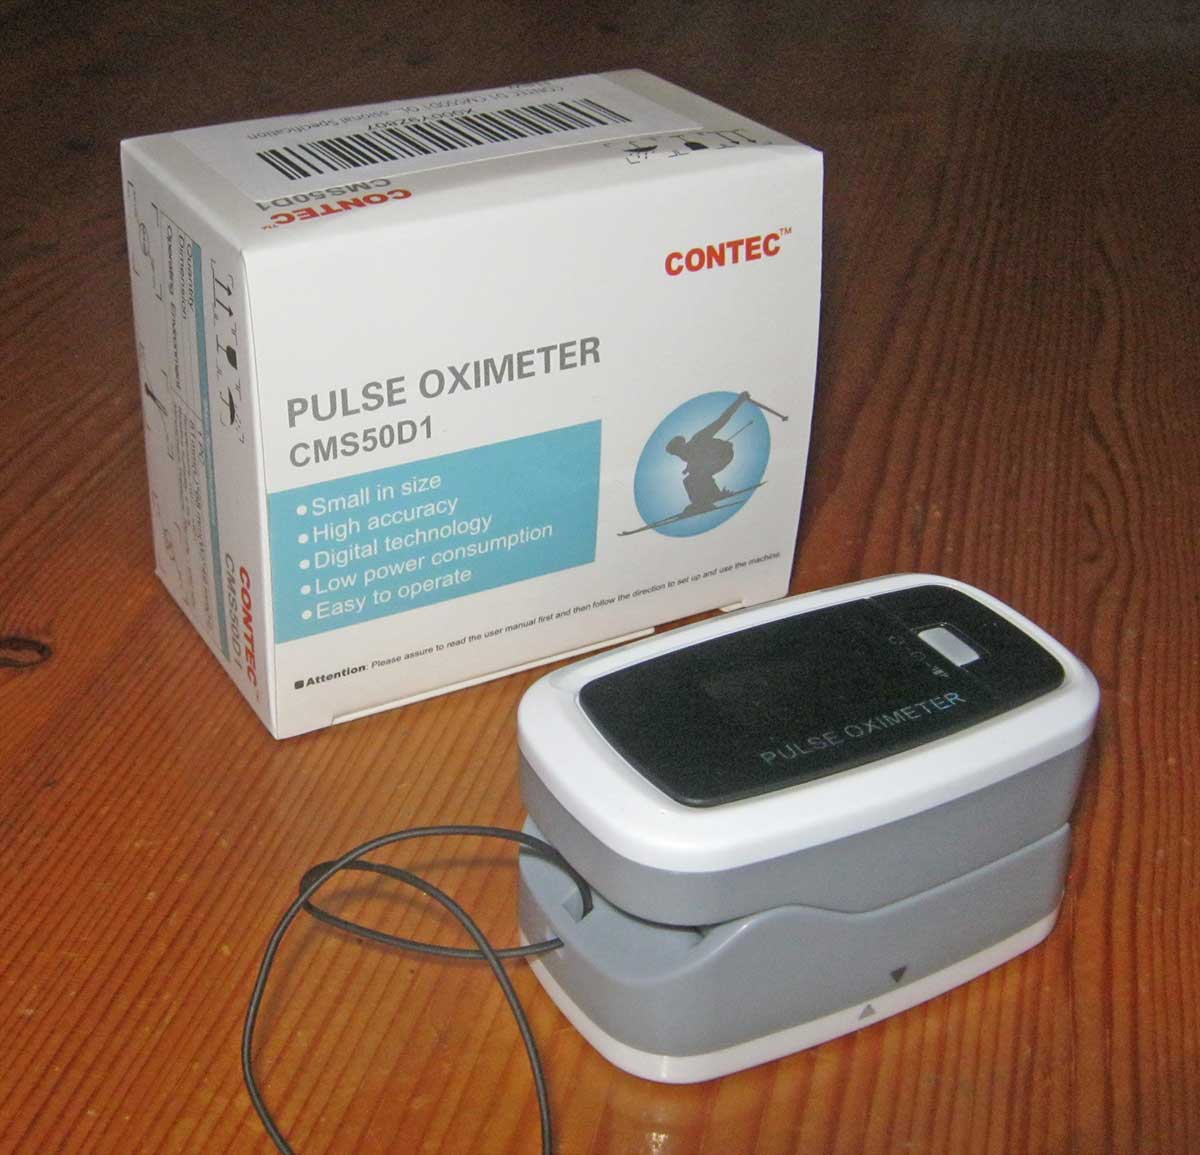 A
doctor in Bournemouth speaking on the evening news suggested
that if you were sick with COVID at home it would be a good idea to have a
little device known as a Pulse Oximeter handy (see photo on right). This
measures the oxygen saturation in the blood and pulse rate by clipping the
device on a finger and pressing a button; the reading should normally be at
least 97%.
A
doctor in Bournemouth speaking on the evening news suggested
that if you were sick with COVID at home it would be a good idea to have a
little device known as a Pulse Oximeter handy (see photo on right). This
measures the oxygen saturation in the blood and pulse rate by clipping the
device on a finger and pressing a button; the reading should normally be at
least 97%.
If the reading falls to about 93% you should call your doctor for advice, and if the reading is consistently below 92% you should consider calling an ambulance or visiting A&E.
Pulse Oximeters can be purchased from Amazon for £18 to £25; alternatively your doctor's surgery might loan you one if you are unwell and have tested COVID positive.
Remember, if you have symptoms of COVID-19 at home and can't count from one to ten out loud due to shortness of breath, you should immediately call your GP, 111 or 999 for advice.
Click for UK government Coronavirus guidance on what you can and cannot do
Notes:
1) Wash your hands thoroughly before touching your face to avoid transferring virus from contaminated surfaces to your mouth, eyes and nose. If outdoors use hand gel.
2) Two metres is further than you think - roughly an arm and a walking stick away.
3) During the lockdown you should not mix with other households indoors.
Minimise exposure time if you unavoidably find yourself mixing in a confined setting - an invisible mist of virus can build up in the air if the space is shared with an infectious person; imagine people exhaling cigarette smoke. Unless you wear a well fitting FFP3 hospital grade face mask you can breath this in; a face covering will offer little protection. The likelihood and extent you get sick will depend on the density of the airborne virus, which can be reduced by ventilation, and the duration of your exposure.
Annex to 28th March update
Commentary
Apart from froth in the media, there has been little of importance to report this week as COVID deaths and hospital admissions continued to fall.
Tuesday was the anniversary of the first COVID lockdown and a one minute's silence was held in memory of the 126,000 victims of the epidemic. Boris Johnson held a COVID press briefing.
We read in the Worcester News that Lateral Flow Tests are now available from Great Malvern Library, and spotted there is a new Worcestershire Vaccination Dashboard showing how many people have been vaccinated - the figures are encouraging.
Earlier in the week there had been violent protests in Bristol by mobs complaining about proposed new police powers.
Labour MP Nadia Whittome proposed there should be a 'National Care Service'. That seems a good idea, but it's something the Gordon Brown government suggested more than 10 years ago.
Click for 2010 government paper on building a National Care Service
David Cameron also thought something should be done but little has happened. Perhaps the COVID epidemic will spark the Johnson government to initiate change.
The spat with the EU about vaccine deliveries has gone quiet.
Click for Bloomberg article about vaccine diplomacy
Labour MP Yvette Cooper argued for hauliers to be tested and from a BBC report it seems that is being considered.
There has been heated discussion in the media about vaccination certificates, but it seems to us the problem will go away once most people are vaccinated.
Vaccines
We wondered exactly what the efficacy numbers for the vaccine meant, and it appears to be simply a ratio of the protection compared to a person who has not been vaccinated.
Click for PHE blog analysing first vaccine effectiveness in the UK
So for example, using the efficacy numbers mentioned last week, after first vaccination you could be roughly half as likely to be infected, the likelihood you fall sick and have to be treated in hospital could be reduced by a factor of 5, and the chance you die from COVID could be reduced by a factor of 7.
Nationwide this is a useful protection, but in the short term while Coronavirus is still prevalent, the risk of death is not reduced to zero for the elderly. For example the risk of dying from COVID could still be approaching 1 in 15 for Seniors mixing freely in the community after a first jab. Hence the government's advice to continue observing the lockdown and social distancing until the prevalence of COVID fizzles out.
The vaccines can be expected to reduce the Effective Reproduction Rate of the present virus so that eventually COVID almost disappears in the UK; and once the prevalence is low the chance of Seniors catching COVID and dying from it in the UK should be small.
However if vaccinated Seniors were to go on holiday abroad this summer, to a country where COVID is prevalent, we think the chance of catching COVID and dying could be up to ~ 5%; possibly even higher if the South African and Brazilian variants were to be involved. Not a risk we would like to take, but some might happily accept.
There have been rumours a first jab only offers 10% protection against some new variants of concern. That figure seems to emanate from a South African study which looked at a number of young people becoming infected. Professor Tim Spector anticipates the present vaccines could nevertheless provide significant protection from severe illness. But even if they don't there is no need to worry as the government is planning booster jabs for the over 70s in the Autumn if needed.
Click for BBC story - Oxford jab offers less S Africa variant protection
Here again is the list of vaccines ordered by the UK - you will see there is plenty of vaccine in the pipeline for delivery later in the year.
| COVID-19 vaccine | Doses ordered (million) | Status |
| Pfizer BioNTech, two dose, -70 deg C | 40 | Approved, delivery has started, made in Belgium (EU) |
| Astrazeneca, two dose, fridge | 100 | Approved, delivery has started. Batches made in UK, Belgium and India. |
| Moderna, two dose, -20 deg C | 7+10 | Approved, first deliveries expected from the USA in April 2021. |
| Valneva, two dose | 60+40 | A jab from French company Valneva will be made in Livingston, West Lothian, Scotland. Delivery to start in second half of 2021. |
| Janssen, single dose | 30 | A jab from Belgian firm Janssen, owned by Johnson and Johnson; phase III trials complete. Approved for use in the USA and EU; possibly available from May. |
| Novavax | 60 | A jab manufactured by US firm Novavax will be made in Stockton-on-Tees; phase III trials complete, could be available later this year. |
| GSK Sanoft | 60 | Some delay due to adjusting the formula to give better protection to the elderly; possible availability late 2021. |
| Curevac | 50 | Contract placed with German company Feb 2021. Possible source of new variant vaccine later in 2021 |
Table of vaccines ordered by the UK government
Recent deaths in Worcestershire hospitals
The table below shows all COVID deaths in Worcestershire hospitals reported by NHS England to 27th March.
| Worcestershire | Cumulative deaths | Weekly increase |
| Acute hospitals | 797 | +4 |
| Care hospitals | 63 | no change |
| TOTAL | 860 | +4 |
In the last week just 4 additional deaths have been recorded compared to 4 the week before.
Present rate of new cases
This week, the average rate of infection per 100,000 population per week in England fell only slightly from 57 to 55. In comparison the figure for Worcestershire is 61, and that in the Malvern Hills 27. Redditch remains a hotspot at 131.
The probability of catching Coronavirus in the Malvern Hills district is now low, and as most Seniors have been vaccinated we judge the risk LOW (except possibly for the especially vulnerable).
The risk of death from Coronavirus for unvaccinated healthy teenagers is small so for them the risk is also LOW. The middle aged can suffer from debilitating Long COVID so for those that have not been vaccinated and live in an area where rates are not falling the risk might be judged LOW to MODERATE.
Forecast of death toll to the end of April
The rolling 7 day average death rate was 62 deaths per day on 28th March and the rate is continuing to fall steadily.
Assuming the death rate falls linearly to 16 deaths per day by the end of April, another 1,287 deaths can be expected by the end of April, which suggests the UK COVID-19 death toll will reach approximately 128,000.
| Date | Forecast UK COVID-19 death toll (PHE basis) |
| March 28th | 126,592 |
| April 30th | +1,287 |
| Total | 127,879 |
Forecast UK COVID-19 epidemic death toll by the end April 2021
Another projection of the future COVID-19 death toll and daily deaths can be found on The Institute for Health Metrics and Evaluation website:
Click for IHME projection of COVID-19 deaths
The latest projection is for 148,000 deaths by the end of April which probably won't be far off the figure reported by the ONS.
At the start of the epidemic in March the Chief Scientific Adviser, Sir Patrick Valance, suggested a death toll of 20,000 would be a good outcome; on the other hand, Professor Neil Ferguson of Imperial College warned in some scenarios the death toll might be as high as 250,000; while we thought, in the very worst case assuming up to 1% of the UK population died the outcome might have been nearer 400,000 taking into account some build up of herd immunity.
So how well will the UK have done? When Sir Patrick Valance spoke off the top of his head there had been few deaths and he clearly did not want to 'scare the horses'. Professor Neil Ferguson was nearest the mark. A few might consider an outcome of 128,000 deaths a fair result compared to a greater number of people dying in a very short space of time, more being permanently disabled by Long COVID, and temporary collapse of the NHS. Members of the Labour Party and others will no doubt say the UK has done very poorly compared to the best performing countries such as Australia, New Zealand and Singapore where deaths have been much lower, not to mention the enormous expense of supporting those out of work and huge damage to the economy. But this pandemic is not played out and it could be a further 1 to 2 years before the 'dust' settles.
At the appropriate time there will no doubt be a full inquiry to learn lessons for the future.
Summary of Links
Symptoms
Article about the effects of Coronavirus on the human body
Reporting and how to obtain a test
How to get a test
https://www.nhs.uk/coronavirus
About joining the Zoe COVID Symptom Study:
Guidance
UK government Coronavirus guidance
Tiers
Guidance on tiers: what you need to know
Government postcode checker to find tier for other areas
Statistics
UK government Coronavirus Dashboard
Coronavirus Dashboard Interactive Map
ONS data on deaths in England and Wales (Excel spreadsheet)
NHS England COVID-19 Daily Deaths
NHS England COVID-19 Hospital Admissions
NHS England vaccination statistics
Reports
ONS Coronavirus (COVID-19) Roundup
The bigger picture
Worldometer summary of coronavirus cases worldwide
European Centre for Disease Prevention and Control info
https://www.ecdc.europa.eu/en/geographical-distribution-2019-ncov-cases
World Health Organisation info
Window on the USA
Centre for Disease Control (CDC)
American Association of Retired People (AARP)
Worcestershire
Help:
http://www.worcestershire.gov.uk/here2help
Worcestershire County Council COVID-19 information:
http://www.worcestershire.gov.uk/coronavirus
Here you will find a useful link,
'Website: Number of new cases by date in Worcestershire'
which displays interesting COVID charts and statistics for Worcestershire
Miscellaneous
Spanish Flu
Dr Jeff Kildea's commentary about the 1919 outbreak of Spanish Flu in Australia
Views of Martin McKee, Professor of European Public Health
Follow Martin McKee on Twitter
SAGE membership
Scientific Advisory Group for Emergencies (SAGE)
Scottish government:
Link to Scottish Government website
Link to Postcode checker for COVID restrictions by protection level in areas of Scotland
Welsh Government:
Guidance on COVID alert levels in Wales
![]()
The interpretations and opinions expressed are our own
Last updated 29th March 2021