Angus and Rosemary's Miscellany
of Malvern - Other Resources
|
Coronavirus (COVID-19) epidemic weekly update for Malvern Seniors4th July 2021 COVID LOCKDOWN in ENGLAND EXIT MOVED TO 19TH JULY Cases rising sharply in the Malvern Hills district Skip to menu of archived pages PreambleWe keep an eye on the published government figures and monitor the media to asses the level of risk for Seniors in the Malvern Hills district. This page is normally updated every Sunday between 1800 and 2400 hours GMT. Information about Coronavirus can be found on the NHS website: https://www.nhs.uk/coronavirus
|
 How
to request a COVID test
How
to request a COVID test
| Districts of Worcs | Cases | Weekly increase | Population |
| Bromsgrove | 6,737 | +190 | 98,529 |
| Malvern Hills | 3,066 | +117 | 77,545 |
| Redditch | 6,540 | +129 | 85,317 |
| Worcester | 6,631 | +242 | 103,542 |
| Wychavon | 6,763 | +148 | 126,240 |
| Wyre Forest | 5,889 | +169 | 100,957 |
| TOTAL | 35,626 | +995 | 592,130 |
| COMPARE WITH | |||
| County of Hereford | 7,587 | +172 | 195,000 |
| Leicester (city of) | 39.900 | +636 | 400,000 |
Cumulative cases reported by PHE in Worcestershire to 4th July 2021
The weekly increase is indicative; the seven day average by area, which varies day to day, is an alternative metric that can be found on the Coronavirus dashboard.
In the absence of other evidence, we imagine the risk to fully vaccinated Seniors remains low, despite 117 new cases in the Malvern Hills.
Interactive map
At the bottom of the Coronavirus Dashboard (daily update) page there is an Interactive Map which is coloured to show the variation in infection rate across the country. The map shows that infection rates are continuing to rise across the UK.
Click for Interactive Map of COVID cases
Note: the Interactive Map works on desktop PCs but it's possible you may encounter difficulties using a tablet or smartphone.
Ripples of the fourth wave are spreading into Worcestershire. Recent weekly cases to 29th June are: North Malvern 19; Malvern Link 3; Pickersleigh 9; Barnards Green 9; Malvern Wells and Priory 11; Callow End and Hanley 6; Upton and Welland 9.
Number of deaths
Statistics on COVID deaths are published by Public Health England, The Office of National Statistics, and NHS England.
PHE figures
Public Health England reports that the cumulative total of COVID (28) deaths in UK hospitals and care homes has risen by 122 in the last week to 128,222 while the daily average has flat-lined at 17 deaths per day.
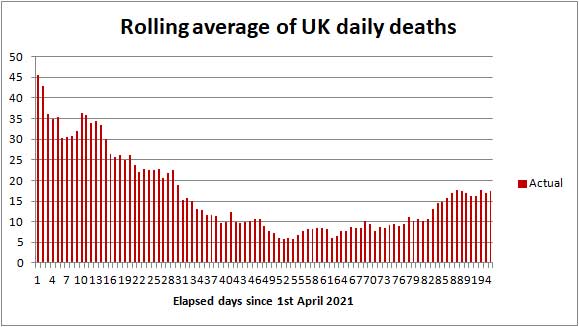
COVID-19 death rate 1st April to 4th July 2021
Click to view the UK government Coronavirus Dashboard
In comparison averaged over recent years 1,700 people die daily from all causes.
ONS figures
The Office of National Statistics (ONS) separately reports registered deaths in England and Wales where COVID-19 is mentioned on the death certificate. The ONS figures lag the PHE figures by 10 - 14 days and do not include Northern Ireland and Scotland.
Click for national ONS data on deaths (Excel spreadsheet)
The ONS figures are broken down by District providing a glimpse of where deaths are occurring. The provisional cumulative total of COVID related deaths in Worcestershire reported by the ONS up to 18th June 2021 (week 24 of 2021) is shown below.
Note: the numbers are from the ONS Death Registrations-Pivot table
| Districts of Worcs | Deaths 2020 |
Deaths 2021 |
Week 24 | Population |
| Bromsgrove | 164 | 101 | 0 | 98,529 |
| Malvern Hills | 61 | 83 | 0 | 77,545 |
| Redditch | 108 | 85 | 0 | 85,317 |
| Worcester | 87 | 116 | 0 | 103,542 |
| Wychavon | 157 | 119 | 0 | 126,240 |
| Wyre Forest | 171 | 106 | 0 | 100,957 |
| TOTAL | 748 | 610 | 0 | 592,130 |
Provisional cumulative COVID-19 deaths registered by ONS to 18th June 2021
Once again no COVID deaths were recorded in Worcestershire.
So far in England and Wales 102 COVID-19 related deaths have been reported by the ONS in the week to 18th June; 18 more than last week. Of these 15 were in a care home, 13 at home, 1 in a hospice, 71 in hospital and 2 elsewhere.
Note: summation of rows 9 to 339 of the ONS deaths Registrations-Pivot table.
The provisional UK COVID-19 death toll (as reported by PHE and ONS) for all weeks of the epidemic can be found on the Deaths tab of the Coronavirus Dashboard.
NHS England figures
The table below shows latest COVID deaths in Worcestershire hospitals reported by NHS England to 3rd July.
| Worcestershire | Cumulative deaths | Past week |
| Acute hospitals | 808 | 0 |
| Care hospitals | 63 | 0 |
| TOTAL | 871 | 0 |
Click for NHS COVID-19 Daily Deaths
Healthcare numbers
The UK government Coronavirus Dashboard includes important information about healthcare statistics.
| Hospital cases (UK) | Number | Change since last week |
| Patients currently in hospital | 1,905 | +400 |
| Patients on ventilation | 300 | +41 |
| Patients admitted daily | 358 | +131 |
Headline summary of patients in hospital as reported 4th July 2021
The daily number of hospital admissions expressed as a 7 day average fell to 100 about 20th May but has crept up to 358 and might be expected to increase further in proportion to the rise in daily cases. If roughly 2,000 new cases per day in May led to 100 daily admissions, then the current (average) 24,000 or so cases per day could see daily admissions rising towards 1,200.
In the past, the steady state number of COVID patients in hospital has been roughly ten time the number of patients admitted daily, so we could see the number of COVID patients in hospital rising towards 12,000 towards the end of July, which would be a significant burden on the NHS.
Last week we assumed that due to vaccination 1 in 10 of those admitted to hospital now dies (whereas last year it was 1 in 5). If we relate the latest average of 17 deaths per day to hospital admissions two weeks ago the figure might be nearer 1 in 12, in which case the present 358 hospital admissions per day could point to a COVID daily death rate of about 30 in the second half of July.
Tabulated figures for bed occupancy in Worcestershire Acute and Care hospitals can be found on the NHS England website.
Click for NHS England COVID-19 Hospital bed Activity
An easy to read summary can be found on the Worcestershire Coronavirus Dashboard.
Click to view Worcestershire Coronavirus Dashboard.
Recently there have been 6 COVID-19 patients occupying Worcestershire Acute Hospital beds, of which 2 are ventilated beds.
Looking to the future, it's possible as hospitals fill in Birmingham, where there are many more cases, part of the overflow could be sent to acute hospitals in Worcestershire.
The main point to note is that the number of Worcestershire COVID-19 beds occupied is very much lower than the peak of about 300 beds.
Forecast for the week ahead
Trends suggest that during the next seven days (up to 11th July) the cumulative total of new UK COVID-19 cases reported by PHE on the Coronavirus Dashboard could increase by 175,000 towards 5,077,000.
This could make British tourists unwelcome in Europe.
In Worcestershire more than 1,000 new cases of COVID-19 can be expected, and possibly 150 cases in the Malvern Hills district.
We estimate the number of COVID (28) deaths will increase by about 120 nationally towards 128,342 during the 7 days ending 11th July 2021.
In the county of Worcestershire, assuming a 0.3% death rate, the 995 new cases this week should translate to no more than 3 COVID deaths per week later in July.
Longer term forecast
When the Alpha (Kent) variant was predominant commentators suggested that the UK could be approaching herd immunity due to both the success of the vaccination programme, and immunity of those who had already been infected by COVID-19. The flare up of cases across the UK caused by the more transmissible Delta variant indicates a higher level of vaccination such as 85% will be needed to counter the Delta Reproduction Rate estimated 6 to 7; and we are nowhere near that yet.
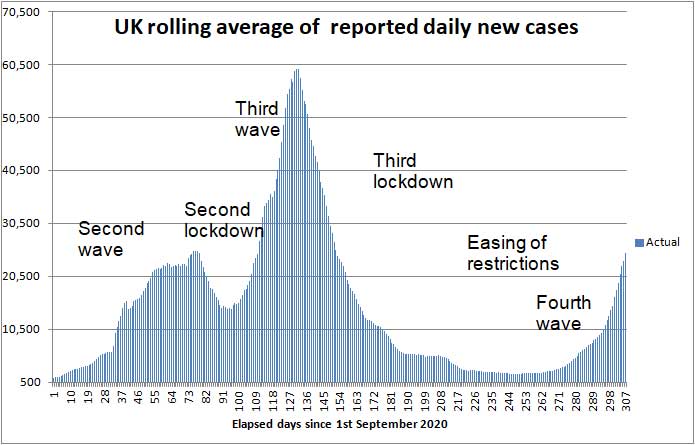
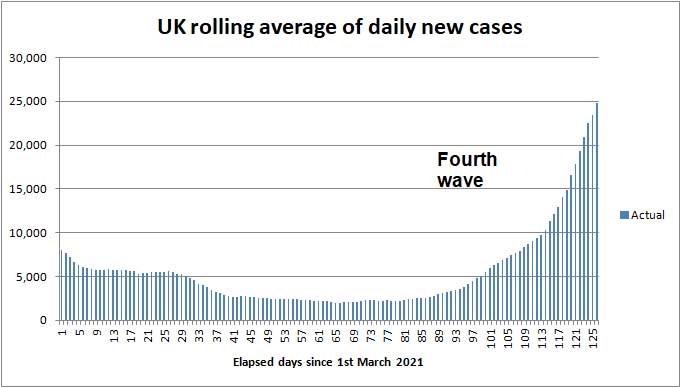
The latest figures suggest to us that current daily cases might be represented by three components: a background level of infection, a 'bump' representing suppression of the first hot-spots of the Delta variant in the North West, and cases in newly emerging hot-spots which have been rising exponentially across much of the UK during the last fortnight.
The next chart shows the rolling average of daily cases in red and an exponential curve fitted to recent data in blue. This was suggesting that daily cases could have risen to 70,000 by the 11th July, but in the last 4 days the rolling average appears to be approaching a plateau, so don't be too concerned.
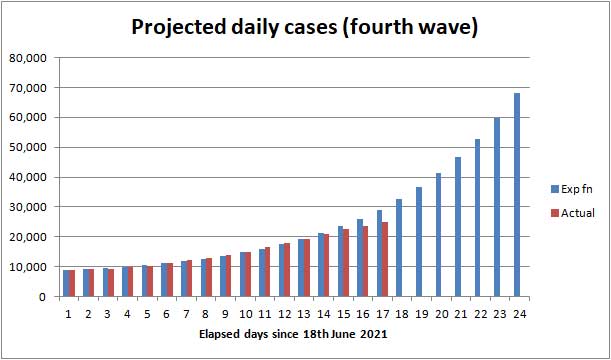
Actual cases to 4th July and exponential projection to 11th
When the government lifts all restrictions on 19th July many more pockets of infection are likely to flare up as the virus moves across the country seeking out the frail and unvaccinated. For a period this may well place a burden on hospitals to the detriment of other patients.
So far the COVID death rate has remained low and our guess is that the death rate during the 'fourth wave' won't rise above 100 before falling back, as the percentage of the vaccinated population rises.
A ripple of cases amongst unvaccinated children and teenagers cannot be ruled out - either in August or when pupils go back to school in September.
Advice for Seniors
 The
daily number of new cases of Coronavirus in the Malvern Hills district
is rising but as most Seniors should
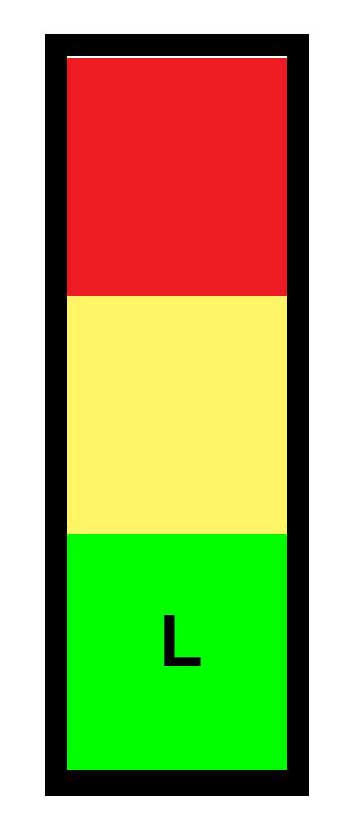
have had 2 jabs we judge the risk of death from COVID-19 for most to be LOW;
see our annex and riskometer opposite.
The
daily number of new cases of Coronavirus in the Malvern Hills district
is rising but as most Seniors should
have had 2 jabs we judge the risk of death from COVID-19 for most to be LOW;
see our annex and riskometer opposite.
But remember, if you are elderly, have not been vaccinated, and were to catch COVID there is a significant chance that you will either die or your long term health may be seriously damaged, so get both doses of your vaccine and continue to take care of yourself and those you love. Last year, 90% of COVID deaths were in those aged over 60 years according to NHS England statistics.
Click for our risk of death table (for those who have not been vaccinated)
It's quite possible, despite a second jab, for Seniors to become ill with COVID-19; some might have mild symptoms like hay fever, while others could feel very poorly, but it is unlikely you will need to be admitted to hospital.
The simple safeguards to remember are to:
-
wash your HANDS thoroughly, using soap and hot water, for 20 seconds, including after handling deliveries to your home, to kill virus picked up from contaminated surfaces see note 1;
-
wear a FACE mask when unavoidably near other people for example when shopping, visiting hospital or the chemist, and using public transport;
-
SPACE at least 2 metres from people outside your 'bubble' see note 2;
-
preferably meet friends and other households outdoors in the FRESH AIR, else keep the windows open if you are indoors;
-
minimise TIME near strangers;
-
self-isolate and book a test if you have COVID-19 symptoms (the top five symptoms amongst the vaccinated are now said to be headache, runny nose, sore throat, sneezing and persistent cough).
-
keep away from areas where the infection rate is known to be high.
Notes:
1) Wash your hands thoroughly before touching your face to avoid transferring virus from contaminated surfaces to your mouth, eyes and nose. If outdoors use hand gel.
2) Two metres is further than you think - roughly an arm and a walking stick away.
3) If possible keep windows and doors open to improve ventilation when meeting others.
Annex to 4th July update
Commentary
The government has had little to say this week following the 'sacking' of Matt Hancock.
Stories leaked to the media suggest the PM is planning to lift all legal COVID restrictions on 19th July and no doubt will rely instead on the 'commonsense of the British people'. The BMA and Independent SAGE are slightly concerned about this.
The PM is expected to make a statement next week.
There have been complaints that significant numbers of school children have needlessly had to isolate because someone in their bubble tested COVID positive. Schools will soon be breaking up for the summer holiday so that's an issue some might not think needs urgent attention. On the other hand immediate steps to vaccinate all those aged 12+ before schools go back in September would seem a good idea.
In a week when we have heard little from the government, there's an opportunity to listen to what the scientists have to say. For example,
Click to watch Tim Spector's weekly Zoe COVID update on YouTube
Independent SAGE have summarised their thoughts on whether the PM should lift all restrictions on 19th July. The start of their weekly briefing has many interesting charts and is worth a view.
Click to watch Independent SAGE 2nd July briefing
The question is asked will COVID flare-ups matter? The answer seems to be yes because there is a danger that if cases rise to a very high level, COVID admissions to hospital will delay other treatments such as hip and knee replacements, and result in many more individuals, of all ages, suffering from Long COVID.
So far there hasn't been a significant increase in the COVID death rate and provided it stays below 100 deaths per day we suspect the government will not be too concerned.
Overseas travel
The situation remains somewhat confused as both the UK and other nations change the rules in response to changes in infection rates.
While rates in the UK are now much higher than in most European countries, travel arrangements for vaccinated individuals are being worked up.
It now seems possible to get an NHS Vaccination Pass for UK events which is only valid for a couple of days, and for overseas travel which requires you to prove your identity for example by providing a photo of your passport.
Click for information about NHS COVID Pass
See BBC report - EU vaccine 'passport' and what it means for travel
If you are worried about either having to change plans or getting on a busy flight it might be best to take your holiday in the UK this year.
List of vaccines (unchanged)
Here is the list of vaccines ordered by the UK - a shortage of vaccine has been limiting the vaccination rate in the UK, while plenty of vaccine is on order for delivery later in the year.
| COVID-19 vaccine | Doses ordered (million) | Status |
| Pfizer BioNTech, two dose, -70 deg C | 40+60 | Approved, deliveries continuing, made in Belgium (EU). An additional 60M doses have been ordered for booster shots for the most vulnerable in the autumn. |
| Astrazeneca, two dose, fridge | 100 | Approved for those aged 30+ years; deliveries continuing. Batches made in UK, Belgium and India. |
| Moderna, two dose, -20 deg C | 7+10 | Approved. First deliveries to Wales and Scotland 7th April 2021 then England 13th April; mainly for those aged under 50 years awaiting vaccination. |
| Valneva, two dose | 60+40 | A jab from French company Valneva will be made in Livingston, West Lothian, Scotland. Delivery to start in second half of 2021. |
| Janssen, single dose | 20 | Approved, a jab from Belgian firm Janssen, owned by Johnson and Johnson; UK approval 28th May. Order reduced from 30 to 20M. |
| Novavax | 60 | A jab manufactured by US firm Novavax is being made in Stockton-on-Tees UK; phase III trials complete, awaiting approval. Should be available later this year. Glaxo Smith Kline (GSK) has been contracted to fill and package vials. |
| GSK Sanoft | 60 | Some delay due to adjusting the formula to give better protection to the elderly; possible availability late 2021. |
| Curevac | 50 | Contract placed with German company Feb 2021. Possible source of new variant vaccine later in 2021 |
Table of vaccines ordered by the UK government
Present rate of new cases and risk
The hotspots in England and Scotland are expanding across the whole of the UK and the general infection rate is now very high; were it not for the vaccines the death rate would be heading towards 500 deaths per day.
The average rate of infection per 100,000 population per week in England has risen from 120 to 208 while in comparison the figure for Worcestershire has risen to 119 and the Malvern Hills to 113.
As a yardstick we suggest a figure of below 10 can be considered LOW.
Areas of high infection still include Blackburn 492, Ribble Valley 395, Rossendale 582, Bolton 285, and Salford 491.
Other areas with many cases include Birmingham, Leeds, Liverpool, Wigan, Manchester, County Durham, Newcastle on Tyne, Dundee, Glasgow and Edinburgh
There is now a fair chance of catching COVID-19 within the Malvern Hills, but as most Seniors have been vaccinated with 2 jabs we judge the risk of death LOW for all except the 'frail'.
The risk of death from Coronavirus for unvaccinated children and healthy teenagers is said to be small so for them the risk is also LOW. There is however emerging concern that a proportion of youngsters might suffer from Long COVID.
The middle aged can suffer from debilitating Long COVID so for those that have not been vaccinated the risk might be judged HIGH.
About the final UK COVID-19 death toll (unchanged)
At the start of the epidemic on 17th March 2020 the Chief Scientific Adviser, Sir Patrick Valance, questioned by the Health Select Committee, did not disagree with Jeremy Hunt's suggestion that a death toll of 20,000 might be a reasonable outcome.
On the other hand, Professor Neil Ferguson of Imperial College warned in some scenarios the death toll might be as high as 250,000; while we thought, in the very worst case assuming up to 1% of the UK population died the outcome might have been nearer 400,000 taking into account some build up of herd immunity.
So how well will the UK have done? When Jeremy Hunt and Sir Patrick Valance spoke there had been few deaths and they clearly underestimated what was to come. Professor Neil Ferguson was nearer the mark. A few might consider an outcome of about 128,000 deaths a fair result compared to a greater number of people dying in a very short space of time, more being permanently disabled by Long COVID, temporary collapse of the NHS and patients dying at home or queued in ambulances outside hospitals. You have only to look at the recent situation in India to imagine what could have happened.
Members of the Labour Party and others will no doubt say the UK has done poorly compared to the best performing countries such as Australia, New Zealand and Singapore where deaths have been much lower, not to mention the enormous expense of supporting those out of work and huge damage to the economy.
With hindsight, deaths might have been much lower if the second lockdown had been continued into December and January, but that would have meant cancelling Christmas, and who knows to what extent the public would have complied.
Worldwide, this pandemic is not played out and it could be a further 1 to 2 years before the 'dust' finally settles. The PM has promised an independent inquiry in Spring 2022 to learn lessons for the future.
Summary of Links
Symptoms
Article about the effects of Coronavirus on the human body
Reporting and how to obtain a test
How to get a test
https://www.nhs.uk/coronavirus
About joining the Zoe COVID Symptom Study:
Guidance
UK government Coronavirus guidance
Tiers
Guidance on tiers: what you need to know
Government postcode checker to find tier for other areas
Statistics
UK government Coronavirus Dashboard
Coronavirus Dashboard Interactive Map
ONS data on deaths in England and Wales (Excel spreadsheet)
NHS England COVID-19 Daily Deaths
NHS England COVID-19 Hospital Admissions
NHS England vaccination statistics
Worcestershire Coronavirus Dashboard
Worcestershire COVID-19 Vaccinations Dashboard
A glimpse of the worldwide vaccination situation can be found on the Our World in Data website.
Click for chart showing % vaccinated
Modelling
A projection of the future COVID-19 death toll and daily deaths can be found on The Institute for Health Metrics and Evaluation website.
Click for IHME projection of COVID-19 deaths
Reports
ONS Coronavirus (COVID-19) Roundup
The bigger picture
Worldometer summary of coronavirus cases worldwide
European Centre for Disease Prevention and Control info
https://www.ecdc.europa.eu/en/geographical-distribution-2019-ncov-cases
World Health Organisation info
Window on the USA
Centre for Disease Control (CDC)
American Association of Retired People (AARP)
Worcestershire
Help:
http://www.worcestershire.gov.uk/here2help
Worcestershire County Council COVID-19 information:
http://www.worcestershire.gov.uk/coronavirus
Here you will find a useful link,
'Website: Number of new cases by date in Worcestershire'
which displays interesting COVID charts and statistics for Worcestershire
Miscellaneous
Spanish Flu
Dr Jeff Kildea's commentary about the 1919 outbreak of Spanish Flu in Australia
Views of Martin McKee, Professor of European Public Health
Follow Martin McKee on Twitter
SAGE membership
Scientific Advisory Group for Emergencies (SAGE)
Scottish government:
Link to Scottish Government website
Link to Postcode checker for COVID restrictions by protection level in areas of Scotland
Welsh Government:
Guidance on COVID alert levels in Wales
![]()
The interpretations and opinions expressed are our own
Last updated 4th July 2021