Angus and Rosemary's Miscellany
of Malvern - Other Resources
|
Coronavirus (COVID-19) epidemic weekly update for Malvern Seniors26th September 2021 DAILY CASES RISING SLIGHTLY Take care as virus still widespread
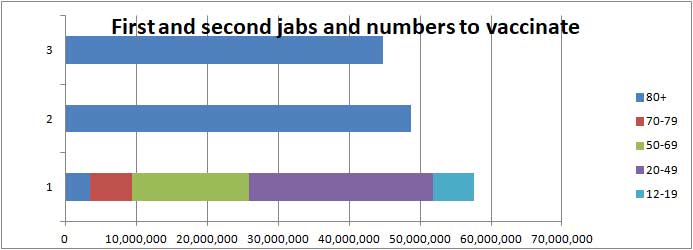
Skip to menu of archived pages PreambleWe keep an eye on the published government figures and monitor the media to asses the level of risk for Seniors in the Malvern Hills district. This page is normally updated every Sunday between 1800 and 2400 hours GMT. Information about Coronavirus can be found on the NHS website: https://www.nhs.uk/coronavirus How to get vaccinatedThe most important thing people can do now is get vaccinated. Most Seniors should have been double jabbed by now, but if not get your vaccine, and encourage your friends and loved ones to get theirs. The effectiveness of the vaccines falls over time so get your booster shot when the time comes. First vaccinations can still be obtained at the Three Counties Show Ground without an appointment. Monday to Friday 8.00am to 5.00pm Saturday 8.00am to 1.30pm (AstraZeneca and Moderna vaccinations available) Use Brown Gate entrance, postcode WR13 6NW
|
 How
to request a COVID test
How
to request a COVID test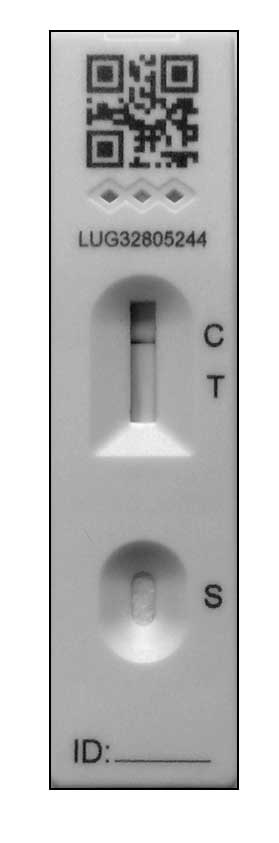 You
can also collect home test kits,
packaged as the COVID-19 Self-Test (Rapid Antigen Test) in boxes of 7 tests,
from the library and most pharmacies such as Boots and Murrays in Church
Street, Claremont House and Lloyds in Barnards Green, Murrays at Prospect
View, Evans and Murrays in Malvern Link, and Boots and Morrisons on the
Enigma Retail Park. (Lateral Flow Device shown on the right).
You
can also collect home test kits,
packaged as the COVID-19 Self-Test (Rapid Antigen Test) in boxes of 7 tests,
from the library and most pharmacies such as Boots and Murrays in Church
Street, Claremont House and Lloyds in Barnards Green, Murrays at Prospect
View, Evans and Murrays in Malvern Link, and Boots and Morrisons on the
Enigma Retail Park. (Lateral Flow Device shown on the right).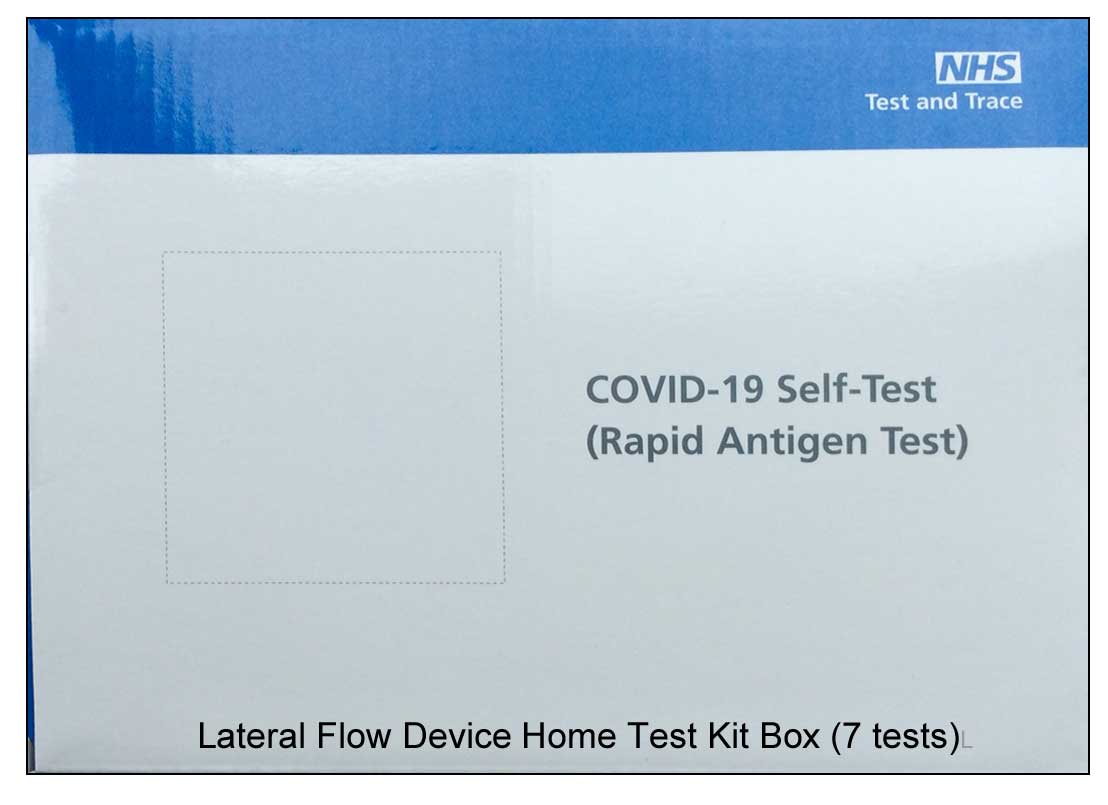
| Districts of Worcs | Cases | Weekly increase | Population |
| Bromsgrove | 11,371 | +444 | 98,529 |
| Malvern Hills | 5,167 | +158 | 77,545 |
| Redditch | 10,044 | +457 | 85,317 |
| Worcester | 10,510 | +211 | 103,542 |
| Wychavon | 10,770 | +446 | 126,240 |
| Wyre Forest | 9,623 | +367 | 100,957 |
| TOTAL | 57,485 | +2,083 | 592,130 |
| COMPARE WITH | |||
| County of Hereford | 14,040 | +1,076 | 195,000 |
| Leicester (city of) | 55,770 | +1,243 | 400,000 |
Cumulative cases reported by PHE in Worcestershire to 26th September 2021
Cases rose significantly this week, possibly driven by schoolchildren, except for the cities of Worcester and Leicester which flat-lined.
Note: the weekly increase is indicative; the seven day average by area, which varies day to day, is an alternative metric that can be found on the Coronavirus dashboard.
Interactive maps
At the bottom of the Coronavirus Dashboard (daily update) page there is an Interactive Map which is coloured to show infection rates across the country. This week the map shows much of the UK has remained dark blue indicating high infection rates, with patches of purple indicating higher rates reducing in Scotland and growing in England.
Click for Interactive Map of COVID cases
Note: the Interactive Map works on desktop PCs but it's possible you may encounter difficulties using a tablet or smartphone.
Recent weekly cases to 20th September are up: North Malvern 13; Malvern Link 13; Pickersleigh 9; Barnards Green 8; Malvern Wells and Priory 9; Callow End and Hanley 14; Upton and Welland 5.
Another map can be found on the Zoe COVID Study website indicating extrapolated cases based on reports from those using the Zoe app.
Click for People with COVID (estimated from the Zoe app)
The Zoe map shows pockets of infection are scattered across England with no clear pattern.
Number of deaths
Statistics on COVID deaths are published by Public Health England, The Office of National Statistics, and NHS England.
PHE figures
Public Health England reports that the cumulative total of COVID (28) deaths in UK hospitals and care homes rose by 965 in the last week to 136,168 while the daily average flat-lined at about 140 deaths per day roughly tracking daily cases reported 20 days earlier.
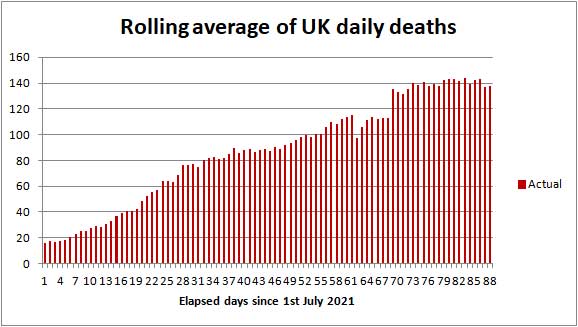
COVID-19 death rate 1st July to 26th September 2021
Click to view the UK government Coronavirus Dashboard
In comparison averaged over recent years 1,700 people die daily from all causes, so COVID deaths contribute 8%.
ONS figures
The Office of National Statistics (ONS) separately reports registered deaths in England and Wales where COVID-19 is mentioned on the death certificate. The ONS figures lag the PHE figures by 10 - 14 days and do not include Northern Ireland and Scotland.
Click for national ONS data on deaths (Excel spreadsheet)
The ONS figures are broken down by District providing a glimpse of where deaths are occurring. The provisional cumulative total of COVID related deaths in Worcestershire reported by the ONS up to 10th September 2021 (week 36 of 2021) is shown below.
Note: the numbers are from the ONS Death Registrations-Pivot table
| Districts of Worcs | Deaths 2020 |
Deaths 2021 |
Week 36 | Population |
| Bromsgrove | 164 | 111 | 1 | 98,529 |
| Malvern Hills | 61 | 85 | 0 | 77,545 |
| Redditch | 108 | 91 | 1 | 85,317 |
| Worcester | 87 | 124 | 0 | 103,542 |
| Wychavon | 157 | 129 | 1 | 126,240 |
| Wyre Forest | 171 | 118 | 2 | 100,957 |
| TOTAL | 748 | 658 | 5 | 592,130 |
Provisional cumulative COVID-19 deaths registered by ONS to 10th September 2021
In week 36 there was 1 COVID death in hospital in Bromsgrove; 1 death in hospital in Redditch; 1 death in hospital in Wychavon; and 2 deaths in hospital in Wyre Forest.
In England and Wales 851 COVID-19 related deaths were reported in the week to 10th September, 194 more than the week before. Of these 86 were in a care home, 54 at home, 697 in hospital and 4 elsewhere. We suspect these figures may have been inflated by delayed reporting of deaths over the Autumn bank holiday.
Note: summation of rows 9 to 339 of the ONS deaths Registrations-Pivot table.
The provisional UK COVID-19 death toll (as reported by PHE and ONS) for all weeks of the epidemic can be found on the Deaths tab of the Coronavirus Dashboard.
NHS England figures
The table below shows latest COVID deaths in Worcestershire hospitals reported by NHS England to 24th September 2021.
| Worcestershire | Cumulative deaths | Past week |
| Acute hospitals | 847 | 7 |
| Care hospitals | 64 | 0 |
| TOTAL | 911 | 7 |
Click for NHS COVID-19 total announced deaths
The Coronavirus Dashboard reports 1 death in the Malvern Hills in the last week.
Note: Statistics can also be found on the Healthcare tab of the UK Coronavirus Dashboard. At the top of the page where it says Healthcare in United Kingdom, click the drop down arrow to select Area Type as NHS Trusts, and Area Name as Worcester Acute Hospitals.
Risk of COVID-19 death by age band (unchanged)
NHS England provides an analysis of COVID-19 deaths in hospital in England and Wales by age band. Shown below is a breakdown of deaths for the period 1st August 2021 to 15th September 2021 when, despite much of the population being protected by the vaccines, particularly the elderly, the death rate rose to 143 deaths per day.
| Age band | Number of deaths | % of deaths |
| 0 - 19 | 9 | 0.3 |
| 20 - 39 | 79 | 2.3 |
| 40 - 59 | 443 | 13 |
| 60 - 79 | 1408 | 42 |
| 80+ | 1422 | 42 |
Current risk of COVID-19 death by age band
Those aged 60+ years now account for about 84% of deaths, not far from the figure of 92% last year, but remember that due to vaccination the death rate as a proportion of new cases is five to ten times lower than in 2020.
The majority of these deaths could be of the vaccine-hesitant, those with underlying conditions such as Diabetes, the frail, and those that are immuno-compromised. The overweight and deprived individuals with a poor diet are also said to be at increased risk.
Risk of death (unchanged)
The infection rate in England is currently about 265 in 100,000 per week so even if this continued all year the chance of catching COVID would be no more than 1 in 7.
Some weeks ago the probability of dying of COVID was about 1 in 500 of those that tested COVID positive (see below) and as most deaths are amongst the elderly the chance of fully vaccinated Seniors dying of COVID could be about 1 in 1,000 of those infected, and the probability of dying of COVID in any one year no more than say 1 in 10,000. Despite the vaccines waning in effectiveness as months go by the odds are unlikely to dip below 1 in 1,000.
These odds are unlikely to worry fully vaccinated healthy and optimistic Seniors wanting to make the most of their remaining years.
On the other hand the risk-averse might be cautious bearing in mind that the vaccines do not work well for about one person in twenty, for example the immuno-suppressed.
Third vaccinations and booster jabs should offer greater protection this winter.
Risk of COVID-19 death by vaccination status (unchanged)
On 13th September 2021 the ONS released a report on deaths involving COVID-19 by vaccination status, England, occurring between 2 January and 2 July 2021. The report concludes, in this period, just 1% of deaths were of fully vaccinated individuals.
This 'headline' is somewhat misleading because the majority of deaths occurred in January and February when few people were vaccinated. We imagine the factor of protection offered by double vaccination is more likely between 5 and 10 but this will not be known for sure until the ONS provides an analysis for more recent months.
Click for ONS report on deaths by vaccination status
Click for ONS spreadsheet of mortality rates
Perhaps more than 50% of COVID deaths are now of the fully vaccinated?
Healthcare numbers
The UK government Coronavirus Dashboard includes important information about healthcare statistics.
| Hospital COVID cases (UK) | Number | Change since last week |
| Patients currently in hospital | 7,124 | - 944 |
| Patients on ventilation | 916 | - 104 |
| Patients admitted daily | 777 | - 155 |
Headline summary of patients in hospital as reported 26th September 2021
NOTES
As a result of the recent dip in daily cases UK hospital admissions have begun to fall, but expect a small uptick next week tracking the rise in daily cases.
As a guide from observing the charts it looked as though currently about:-
-
1 in 35 of new of cases are hospitalised 8 days after testing positive.
-
1 in 350 of new cases die on average 20 days after being tested positive.
These ratios depend on the percentage of infected individuals coming forward to be tested, the proportion of young people in the mix, and the effectiveness of the vaccines all of which will vary over time. More favourable figures may emerge following booster jabs and if infections are mostly amongst the young.
 Worcestershire hospital beds
Tabulated figures for bed occupancy in Worcestershire Acute and Care hospitals can be found on the NHS England website.
Click for NHS England COVID-19 Hospital bed Activity
An easy to read summary can be found on the Worcestershire Coronavirus Dashboard.
Click to view Worcestershire Coronavirus Dashboard.
There are now 38 COVID-19 patients occupying Worcestershire Acute Hospital beds, of which 2 are ventilated beds; roughly 14% of the peak experienced last January.
Bed occupancy has remained fairly flat in recent weeks.
Click for Simple Summary of Malvern numbers on the Coronavirus dashboard
Forecast for the week ahead
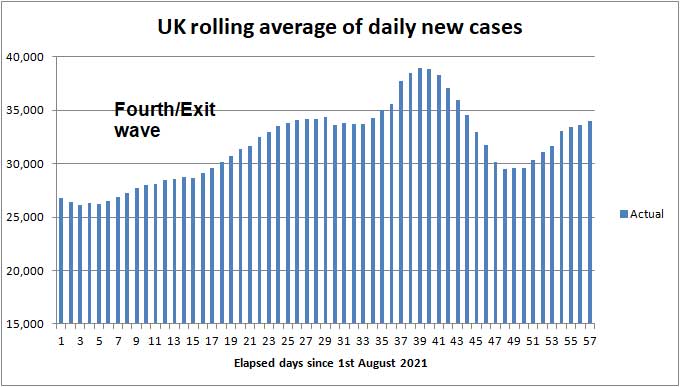
Trends suggest that during the next seven days (up to 3rd October) the cumulative total of UK COVID-19 cases reported by PHE on the Coronavirus Dashboard could increase by 244,000 towards 7,908,000 while the 7 day rolling average of daily new cases could flat-line at about 34,000.
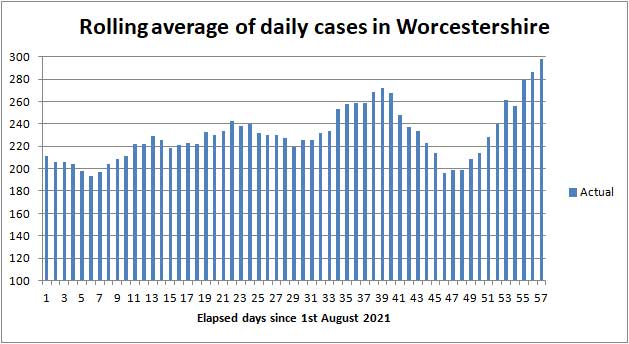
In Worcestershire about 2,000 new cases of COVID-19 can be expected, and 160 cases in the Malvern Hills district.
We estimate the number of UK COVID (28) deaths will increase by about 980 towards 137,200 during the 7 days ending 3rd October 2021, with the average daily death rate flat-lining at about 140 deaths per day and then falling slightly the week after.
In the county of Worcestershire, assuming a 0.3% death rate, the 2,083 new cases this week may translate to 6 COVID deaths per week in the middle of October.
Hospital admissions in England will probably rise a little next week, tracking daily cases.
Longer term outlook
Daily cases amongst adults in England have either been flat-lining or falling a tad, whilst cases in unvaccinated schoolchildren have been rising steeply following return to school. As children develop resistance to infection from vaccination and adults receive booster jabs there should be a downturn in cases by Christmas.
Modelling figures from University College London suggest the 7-day average of daily deaths and the prevalence of infection will decline slowly reaching a minimum in December.
Click for UCL Long-term forecasting of the COVID-19 epidemic
SPI-M modelling, for the government, suggests during the next two months, daily cases could either remain fairly flat (R close to 1) or rise putting hospitals in danger of being overwhelmed (were R to increase towards 1.5) which could trigger the government to implement PLAN B of their Winter Plan.
For a fixed level of vaccination, daily cases are a signpost to whether daily hospital admissions and deaths are going to go up or down. Based on our heuristic 'rules of thumb' - hospital admissions, cases of Long COVID and deaths can currently be expected to follow daily cases roughly in the ratio:
-
Hospital admissions 1:35 of daily cases reported by PHE, lagging by 8 days.
-
Long COVID 1:35 of daily cases reported by PHE.
-
Deaths 1:350 of daily cases reported by PHE, lagging by about 20 days.
-
UK Hospital bed occupancy - one quarter of daily cases, lagging by up to a month.
Advice for Seniors (unchanged)
 Recently
there have been no more than 12 COVID related deaths per week in Worcestershire
which has a population of 600,000 so we judge the
risk of death for fully vaccinated
Seniors to be
fairly
LOW while the risk of Long COVID might be MODERATE;
see our annex and riskometer opposite.
Recently
there have been no more than 12 COVID related deaths per week in Worcestershire
which has a population of 600,000 so we judge the
risk of death for fully vaccinated
Seniors to be
fairly
LOW while the risk of Long COVID might be MODERATE;
see our annex and riskometer opposite.
Remember, if you are elderly, have not been vaccinated, and were to catch COVID there is a significant chance that you will either die or your long term health may be seriously damaged, so if you are able get both doses of your vaccine and continue to take care of yourself and those you love. Also encourage others to be vaccinated.
Click for our risk of death table (for those who have not been vaccinated)
Like Sajid Javid, it is quite possible, despite a second jab, for Seniors to become ill with COVID-19; some might have mild symptoms like a common cold or hay fever, while others could feel very poorly, but few except the frail and vulnerable will need to be admitted to hospital.
Until daily cases fall markedly the simple safeguards to remember are to:
-
wash your HANDS thoroughly, using soap and hot water, for 20 seconds, including after handling deliveries to your home, to kill virus picked up from contaminated surfaces see note 1;
-
wear a FACE covering when unavoidably near other people for example when shopping, visiting hospital or the chemist, and using public transport;
-
SPACE at least 2 metres from people you don't feel safe with see note 2;
-
preferably socialise with friends and other households outdoors in the FRESH AIR else, if you can, keep doors and windows open if you are indoors;
-
avoid crowds and minimise TIME near strangers;
-
look out for symptoms and self-isolate and book a test if you feel unwell; according to the Zoe COVID Study the top five symptoms amongst the fully vaccinated in order of prevalence are said to be runny nose (75%), headache (73%), sneezing (67%), sore throat (53%), and loss of smell (51%);
-
respect others and give them space.
Notes:
1) Wash your hands thoroughly before touching your face to avoid transferring virus from contaminated surfaces to your mouth, eyes and nose. If outdoors use an alcohol based hand gel.
2) Two metres is further than you think - roughly an arm and a walking stick away.
Annex to 26th September update
Commentary
Little to report this week as daily hospital admissions fell slightly and the death rate flat-lined. Daily cases, after dipping, have begun rising again particularly in unvaccinated schoolchildren who may infect parents and grandparents so hospitalisations could go up a tad next week.
A media frenzy has developed with scaremongering stories about sharply rising wholesale gas prices, a shortage of carbon dioxide for food packaging, and a shortage of HGV drivers. A BBC report of delayed delivery of fuel to some BP garages has led to panic-buying at the pumps leading to short term shortages, while opposition MPs have been speculating there will be no turkeys or toys at Christmas. For the time being COVID is no longer making the headlines!
Our son reports that in Singapore daily cases have spiked following relaxation of restrictions so, unlike the UK, some restrictions have been re-imposed.
Weekly updates
Here are links to the weekly Zoe COVID Study, and Independent SAGE updates:-
Click to watch Tim Spector's Zoe COVID Study 22nd September update
The Independent SAGE weekly briefing of 24th September discusses at length how the numbers have been changing and the Independent SAGE Winter Plan.
Click to watch Independent SAGE 24th September briefing
Click to read Independent SAGE nine point Winter Plan
Independent SAGE are recommending light restrictions similar to those in Europe now, whilst the government will only implement their PLAN B if things 'go wrong'.
U3A (unchanged)
Malvern U3A groups have resumed. Some groups are continuing to meet using Zoom while others are meeting in person.
Members are being asked not to attend meetings if feeling unwell. Names will be taken at meetings and could be passed to NHS Test and Trace if a member subsequently tests COVID positive. Refreshments are unlikely to be provided at present.
Overseas travel (unchanged)
The international travel traffic light system is being replaced in England with a single red list with effect from 4 October 2021.
Then, fully vaccinated individuals returning to the UK from other countries won't have to take a PCR test before departure and soon after will just have to take a Lateral Flow Test on arrival.
Click for BBC report: Amber list scrapped in overhaul of travel rules in England
List of vaccines
Here is the list of vaccines ordered by the UK. Plenty of vaccine is on order for delivery later in 2021 for booster jabs and vaccinating those aged 12 - 18 years.
| COVID-19 vaccine | Doses ordered (million) | Status |
| Pfizer BioNTech, two dose, -70 deg C | 40+60+35 | Approved, deliveries continuing, made in Belgium (EU). An additional 60M doses have been ordered for booster shots for the most vulnerable in the autumn. A further 35M doses were ordered in August 2021 for delivery in 2022. |
| Astrazeneca, two dose, fridge | 100 | Approved for those aged 30+ years; deliveries continuing. Batches made in UK, Belgium and India. |
| Moderna, two dose, -20 deg C | 7+10 | Approved. First deliveries to Wales and Scotland 7th April 2021 then England 13th April; mainly for those aged under 50 years awaiting vaccination. |
| Valneva, two dose | 60+40 order cancelled |
A jab from French company Valneva will be made in Livingston, West Lothian, Scotland. Order cancelled September 2021. Delivery had been expected to start in second half of 2021. |
| Janssen, single dose | 20 | Approved, a jab from Belgian firm Janssen, owned by Johnson and Johnson; UK approval 28th May. Order reduced from 30 to 20M. |
| Novavax | 60 | A jab manufactured by US firm Novavax is being made in Stockton-on-Tees UK; phase III trials complete, awaiting approval. Should be available later this year. Glaxo Smith Kline (GSK) has been contracted to fill and package vials. |
| GSK Sanofi | 60 | Some delay due to adjusting the formula to give better protection to the elderly; expect approval end 2021. |
| Curevac | 50 | Contract placed with German company Feb 2021. Possible source of new variant vaccine later in 2021 |
Table of vaccines ordered by the UK government
Present rate of new cases and risk
The average rate of infection per 100,000 population per week in England has risen slightly to 302 while in comparison the figure for Worcestershire is now 306 and the Malvern Hills 172.
As a yardstick we suggest a figure of below 10 can be considered LOW.
The probability of fully vaccinated Seniors without underlying conditions catching and dying from COVID-19 is now possibly somewhere in the range 1 in 1,000 to 1 in 10,000 per year so we judge the risk fairly LOW. Perhaps as many as 3% to 5% of people who catch COVID suffer from Long COVID so that risk might be assessed MODERATE.
The risk of death from Coronavirus for unvaccinated children and healthy teenagers is said to be small so for them the risk is LOW.
About the UK COVID-19 final death toll
The UK is probably going to have to live with COVID-19 and a background level of infection which may increase every winter as more time is spent indoors. Barring new variants, this could result in many thousands of COVID deaths per year, as with flu. So in that respect there can be no 'final' death toll.
The present 2020/2021 death toll will likely climb from 136,000 towards 145,000 by Christmas 2021 based on the PHE definition of deaths. If ONS figures are used the UK toll could be heading towards 200,000.
Worldwide, this pandemic is not played out and it could be a further 2 to 3 years before the 'dust' finally settles and third world countries are vaccinated. The PM has promised an independent inquiry in Spring 2022 to learn lessons for the future.
At the start of the epidemic on 17th March 2020 the Chief Scientific Adviser, Sir Patrick Valance, questioned by the Health Select Committee, did not disagree with Jeremy Hunt's suggestion that a death toll of 20,000 might be a reasonable outcome.
On the other hand, Professor Neil Ferguson of Imperial College warned in some scenarios the death toll might be as high as 250,000; while we thought, in the very worst case assuming up to 1% of the UK population died the outcome might have been nearer 400,000 taking into account some build up of herd immunity.
So how well will the UK have done? When Jeremy Hunt and Sir Patrick Valance spoke there had been few deaths and they clearly underestimated what was to come. Professor Neil Ferguson was nearest the mark. A few might consider an outcome of about 145,000 deaths during 2020 and 2021 a fair result compared to a greater number of people dying in a very short space of time, more being permanently disabled by Long COVID, temporary collapse of the NHS and patients dying at home or queued in ambulances outside hospitals. You have only to look at the recent situation in India to imagine what could have happened.
Members of the Labour Party and others will no doubt say the UK has done poorly compared to the best performing countries such as New Zealand and Singapore where deaths have been much lower, not to mention the enormous expense of supporting those out of work and huge damage to the economy. Bear in mind the situation in New Zealand has not played out. NZ has been slow to vaccinate and it has yet to be seen whether their border controls will stop the spread of the Delta variant.
With hindsight, deaths might have been much lower if the second lockdown had been continued into December and January, but that would have meant cancelling Christmas, and who knows to what extent the public would have complied.
A member of the marketing team at US company 'My Bio Source' sent us a link to a History of Pandemics. Let's hope our brilliant scientists can continue to protect us from future threats.
Summary of Links
Symptoms
Article about the effects of Coronavirus on the human body
Reporting and how to obtain a test
How to get a test
https://www.nhs.uk/coronavirus
About joining the Zoe COVID Symptom Study:
Guidance
UK government Coronavirus guidance
COVID Alert states
Guidance on UK COVID-19 alert level methodology: an overview
COVID-19 Alert Level lowered to 3 on 10th May 2021
Tiers
Guidance on tiers: what you need to know
Government postcode checker to find tier for other areas
Statistics
UK government Coronavirus Dashboard
Coronavirus Dashboard Interactive Map
ONS data on deaths in England and Wales (Excel spreadsheet)
NHS England COVID-19 Daily Deaths
NHS England COVID-19 Hospital Admissions
NHS England vaccination statistics
Worcestershire Coronavirus Dashboard
Worcestershire COVID-19 Vaccinations Dashboard
A glimpse of the worldwide vaccination situation can be found on the Our World in Data website.
Click for chart showing % vaccinated
Modelling
A forecast of the progression of the COVID-19 epidemic can be found on a University College London (UCL) website.
Click for UCL Long-term forecasting of the COVID-19 epidemic
A projection of the future COVID-19 death toll and daily deaths can be found on The Institute for Health Metrics and Evaluation website.
Click for IHME projection of COVID-19 deaths
Reports
ONS Coronavirus (COVID-19) Roundup
The bigger picture
Worldometer summary of coronavirus cases worldwide
European Centre for Disease Prevention and Control info
https://www.ecdc.europa.eu/en/geographical-distribution-2019-ncov-cases
World Health Organisation info
Window on the USA
Centre for Disease Control (CDC)
American Association of Retired People (AARP)
Worcestershire
Help:
http://www.worcestershire.gov.uk/here2help
Worcestershire County Council COVID-19 information:
http://www.worcestershire.gov.uk/coronavirus
Here you will find a useful link,
'Website: Number of new cases by date in Worcestershire'
which displays interesting COVID charts and statistics for Worcestershire
Miscellaneous
Spanish Flu
Dr Jeff Kildea's commentary about the 1919 outbreak of Spanish Flu in Australia
Views of Martin McKee, Professor of European Public Health
Follow Martin McKee on Twitter
SAGE membership
Scientific Advisory Group for Emergencies (SAGE)
Scottish government:
Link to Scottish Government website
Link to Postcode checker for COVID restrictions by protection level in areas of Scotland
Welsh Government:
Guidance on COVID alert levels in Wales
![]()
The interpretations and opinions expressed are our own
Last updated 27th September 2021