Angus and Rosemary's Miscellany
of Malvern - Other Resources
|
Coronavirus (COVID-19) epidemic weekly update for Malvern Seniors21st November 2021 GET VACCINATED AND TAKE CARE AS VIRUS STILL WIDESPREAD Skip preamble and go to summary Skip to menu of archived pages PreambleWe keep an eye on the published government figures and monitor the media to asses the level of risk for Seniors in the Malvern Hills district. We also provide links to where further information can be found. This page is normally updated every Sunday between 1800 and 2400 hours GMT. Information about Coronavirus can be found on the NHS website: https://www.nhs.uk/coronavirus How to get vaccinatedThe most important thing everyone can do now is get vaccinated. Most Seniors should have been double jabbed months ago, but if not get your vaccine, and encourage your friends and loved ones to get theirs. The effectiveness of the vaccines falls over time so remember to get your booster shot six months after your second jab. You should get a reminder either from the NHS or your GP surgery; this could be by letter, or a text message if you have registered a mobile phone number. Boosters can now be had without an appointment at the Three Counties Show Ground. See the NHS website for opening times and vaccine availability: Alternatively, when the time comes, try booking an appointment at your GP surgery. Note: the immuno-suppressed may be offered a third jab as part of their primary course, followed by a booster later.
|
 How
to request a COVID test
How
to request a COVID test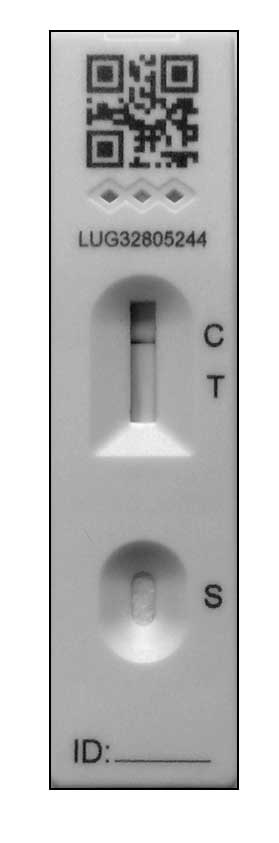 You
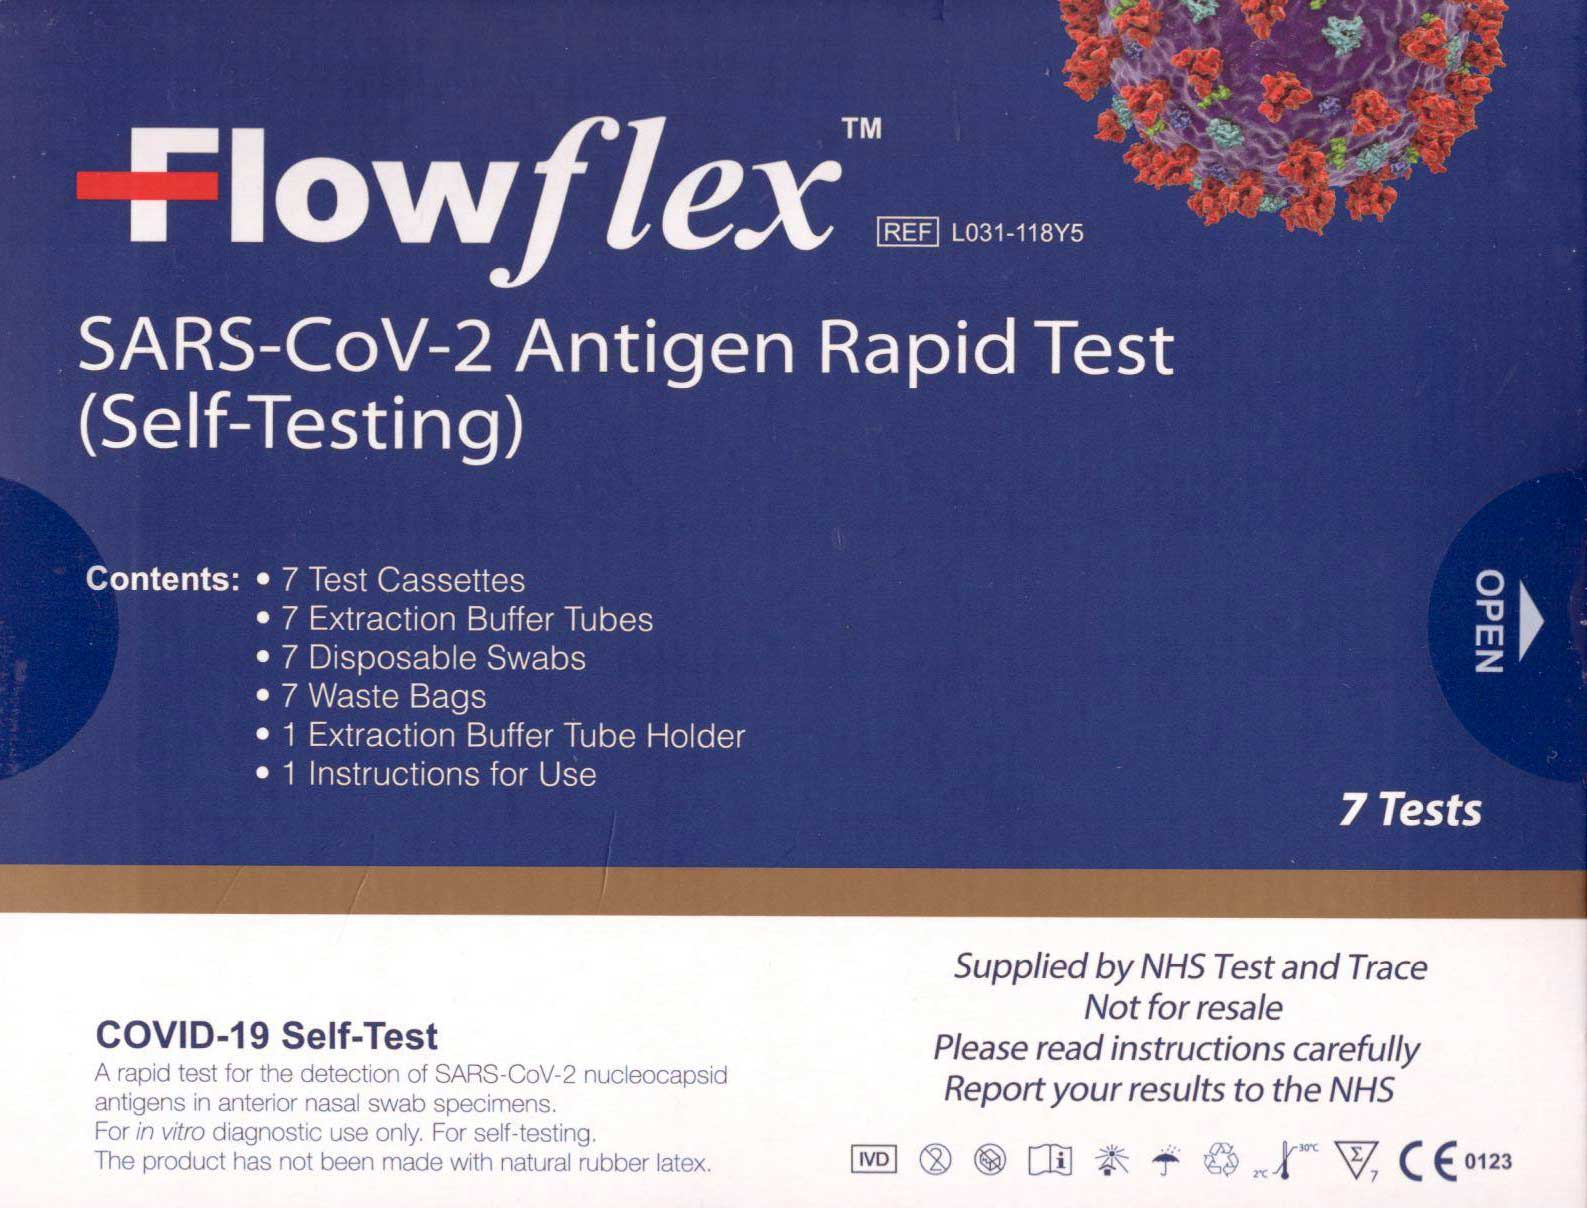
can collect home test kits,
for example packaged as the COVID-19 Self-Test (Rapid Antigen Test) in boxes
of 7 tests, from Malvern library, the Co-op, and most pharmacies such as Boots and Murrays in Church
Street, Claremont House and Lloyds in Barnards Green, Murrays at Prospect
View, Evans and Murrays in Malvern Link, and Boots and Morrisons on the
Enigma Retail Park.
You
can collect home test kits,
for example packaged as the COVID-19 Self-Test (Rapid Antigen Test) in boxes
of 7 tests, from Malvern library, the Co-op, and most pharmacies such as Boots and Murrays in Church
Street, Claremont House and Lloyds in Barnards Green, Murrays at Prospect
View, Evans and Murrays in Malvern Link, and Boots and Morrisons on the
Enigma Retail Park.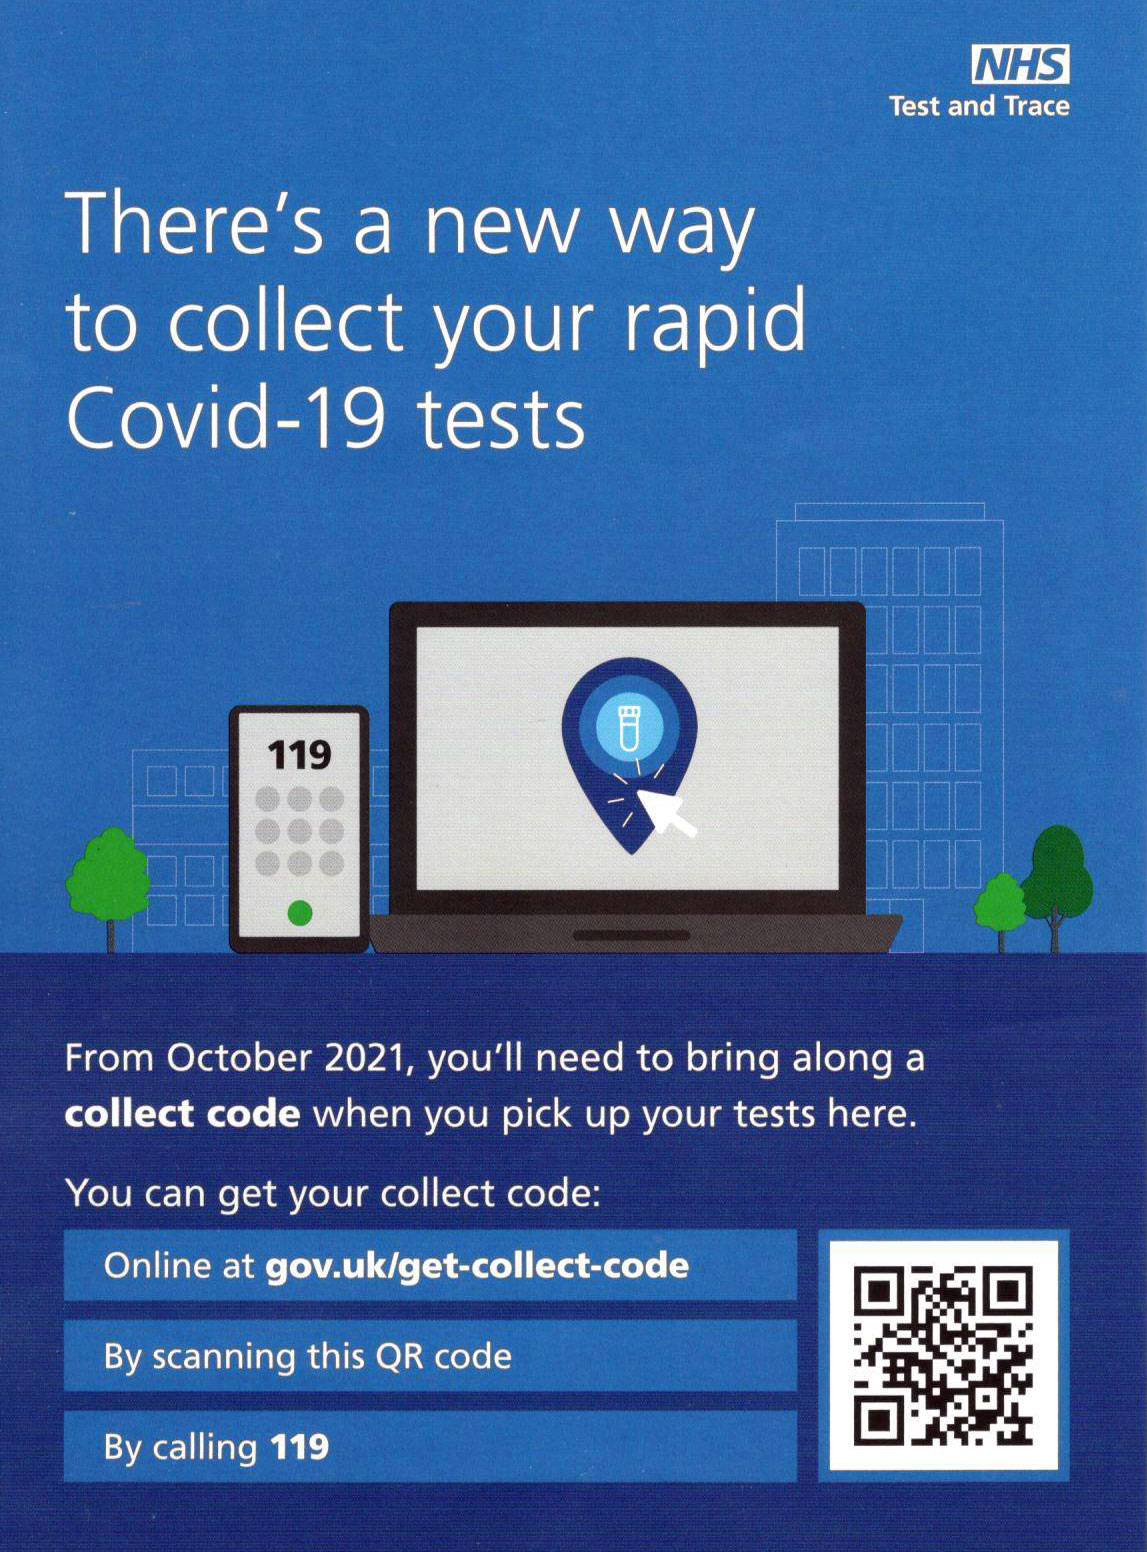
| Country | 12-15 years | 16-17 years |
| England | 40% | 64% |
| Wales | 58% | 79% |
| Scotland | 57% | 77% |
| NI | 26% | 57% |
Percentage of children vaccinated as of 19th November
source: Independent SAGE
The ONS thinks about 90% of adults have antibodies either through infection or vaccination, but achieving herd immunity is unlikely as somewhere between 6 and 30% of the double vaccinated can catch the Delta variant of COVID-19; nevertheless vaccination is most important to protect as many individuals as possible from debilitating long term loss of smell and taste, Long COVID, serious illness, and death.
Click for NHS video warning young people of the dangers of the virus for the unvaccinated.
Vaccination statistics can be found on the Vaccination tab of the Coronavirus Dashboard.
Booster jabs
By now all those aged 70+ years should either have received a letter or text message from their GP surgery or a letter from the NHS asking people to book an appointment for their booster. You may have to wait a week or two, but it should not be difficult to get a booster jab in Great Malvern and surrounds.
The number of booster jabs given in England can be found in a spreadsheet on the NHS England website. Look in the data section for the COVID-19 daily announced vaccinations Excel file which gives a breakdown of jabs by region and age.
Click for NHS COVID-19 vaccinations
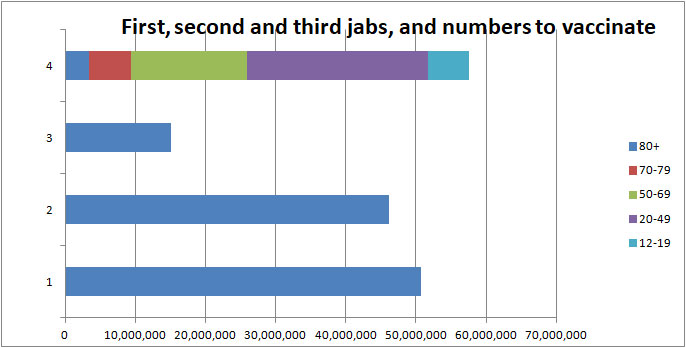
The Coronavirus dashboard reports as of 21st November 15,064,693 booster jabs and third doses have been given in the UK.
Now there are about 10M people aged 70+ to vaccinate, but half the jabs were initially given to others including NHS staff, so it could be towards Christmas before all those aged 70+ are boosted.
The booster rate is now about 2.5M per week.
Now that those aged 40+ years will in turn become eligible there are about 37M in total to boost. Assuming 2M jabs per week taking account of lower rates during the Christmas and New Year holiday we anticipate the youngest of those aged 50+ might have to wait until towards the end of January and those aged 40+ the middle of March for their booster.
Vaccinations Worldwide
A chart of the worldwide vaccination situation can be found on the Our World in Data website.
Click for worldwide statistics
Note: click the country list on the left hand side of the screen to add or remove countries from the chart.
The UK did well to start with but has fallen a little behind many other countries. For example Portugal has fully vaccinated 88% of its population, Singapore 92% and Malaysia 76%, compared to 67% in the UK. Australia has overtaken the UK with 70% fully vaccinated and may soon open its borders to the fully jabbed.
 Number of cases
During the last week the average rate of people testing COVID positive in the UK reported by PHE on the 'Coronavirus Dashboard' rose slightly from 37,488 to 41,029 cases per day.
The ZOE COVID Study estimates there are more likely 71,000 cases per day compared to 65,000 last week.
The chart below shows broadly how the daily rate reported by PHE has varied since 1st September.
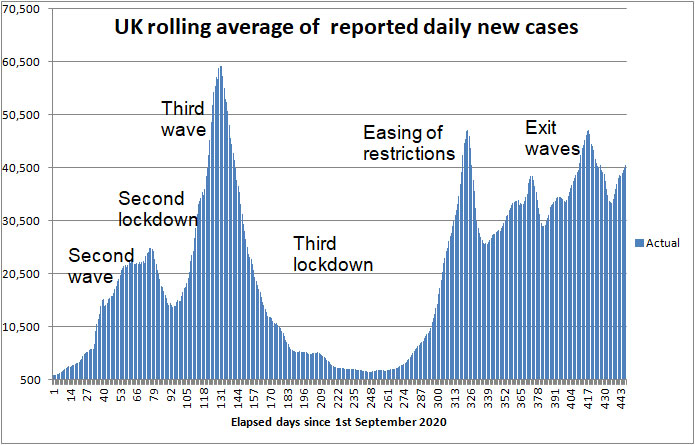
UK daily confirmed COVID cases 1st September 2020 to 21st November 2021
In recent weeks cases have bumped along at roughly 35,000 new cases per day.
Zooming in, the next chart shows in more detail how daily UK cases have changed in the last few days.
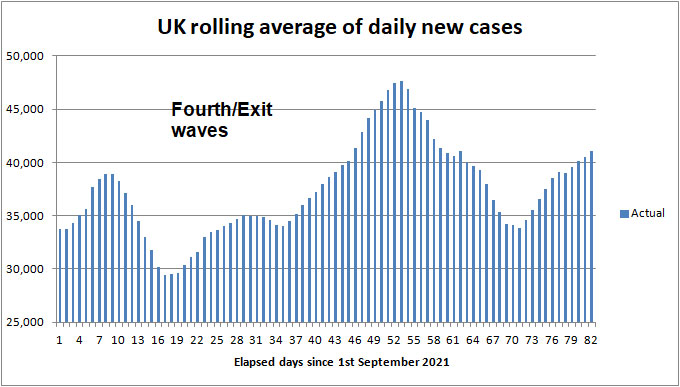
UK daily new confirmed COVID cases 1st August to 21st November 2021
It looks as though the recent rise probably fuelled by schoolchildren returning after half term may be levelling off.
During the last week the cumulative total of confirmed UK COVID-19 cases reported by PHE rose by 284,393 to 9,845,492. That's a lot but it's a comfort rates aren't spiking.
In Worcestershire there have now been 79,016 confirmed cases of COVID-19 an increase of 2,944 on last week.
The next chart shows how daily cases in Worcestershire have risen in the last week.
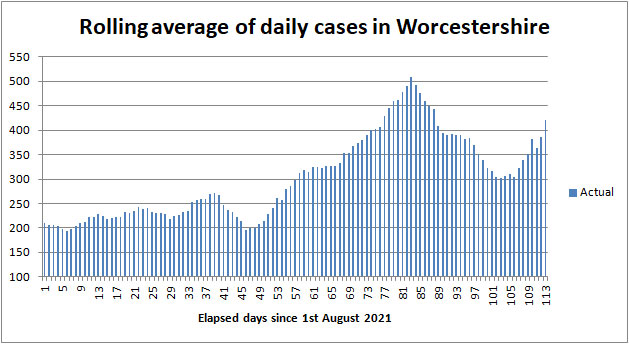
Daily cases in Worcestershire from 1st August to 21st November 2021
The rolling average of daily cases rose significantly from 304 to 421.
The breakdown by Worcestershire Lower Tier Local Authorities (LTLA) is shown in the following table, together with comparisons for Herefordshire, a more sparsely populated county, and the city of Leicester.
Note: the cumulative cases are copied from the 'Cases by area' (whole pandemic) data set of the Coronavirus Dashboard. The weekly increase is the difference between this week and last week's total.
| Districts of Worcs | Cases | Weekly increase | Population |
| Bromsgrove | 15,528 | +531 | 98,529 |
| Malvern Hills | 7,391 | +327 | 77,545 |
| Redditch | 13,537 | +456 | 85,317 |
| Worcester | 13,640 | +586 | 103,542 |
| Wychavon | 15,362 | +637 | 126,240 |
| Wyre Forest | 13,558 | +407 | 100,957 |
| TOTAL | 79,016 | +2,944 | 592,130 |
| COMPARE WITH | |||
| County of Hereford | 21,208 | +905 | 195,000 |
| Leicester (city of) | 65,244 | +1,322 | 400,000 |
Cumulative cases reported by PHE in Worcestershire to 21st November 2021
Daily cases rose significantly in Worcestershire, less so in Herefordshire, and remained level in the city of Leicester.
Note: the weekly increase is indicative; the seven day average by area, which varies day to day, is an alternative metric that can be found on the Coronavirus dashboard.
Cases in Malvern Hills by age group
On the cases tab of the Coronavirus dashboard you can either select the county of Worcestershire or a local authority such as the Malvern Hills, and there you can find a heat map showing cases by age group over time and a chart comparing the number of cases under 60 years with those aged 60+.
The latest figures show the infection rate in those aged 60+ years is 5 times lower and going down, compared to those below the age of 60, whilst the heat map shows since the autumn the infection rate has been highest in those of school age.
Click for cases by specimen date age demographics in the Malvern Hills
Interactive maps
At the bottom of the Coronavirus Dashboard (daily update) page there is an Interactive Map which is coloured to show infection rates across the country.
This week much of England and Wales turned purple reflecting the bump up in cases.
Click for Interactive Map of COVID cases
Note: the Interactive Map works on desktop PCs but it's possible you may encounter difficulties using a tablet or smartphone.
Recent weekly cases to 16th November are: North Malvern 27; Malvern Link 13; Pickersleigh 16; Barnards Green 20; Malvern Wells and Priory 32; Callow End and Hanley 17; Upton and Welland 20.
Another map can be found on the Zoe COVID Study website indicating extrapolated cases based on reports from those using the Zoe app.
Click for People with COVID (estimated from the Zoe app)
Number of deaths
Statistics on COVID deaths are published by Public Health England, The Office of National Statistics, and NHS England.
PHE figures
Public Health England reports that the cumulative total of COVID (28) deaths in UK hospitals and care homes rose by 1,029 in the last week to 143,927 while the daily average fell slightly from 156 to 147 deaths per day.
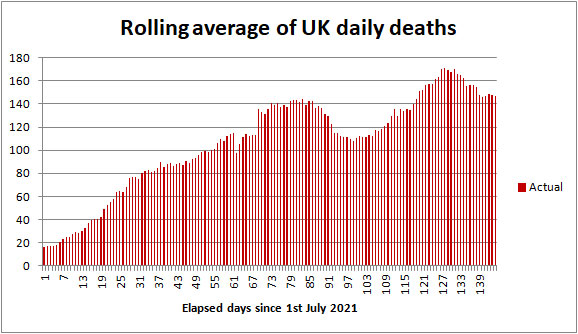
COVID-19 death rate 1st July to 21st November 2021
Click to view the UK government Coronavirus Dashboard
Since England emerged from lockdown on 19th July about 15,000 people have died of COVID-19; mostly the elderly.
In comparison averaged over recent years 1,700 people die daily from all causes, so COVID deaths now account for about 9%.
ONS figures
The Office of National Statistics (ONS) separately reports registered deaths in England and Wales where COVID-19 is mentioned on the death certificate. The ONS figures lag the PHE figures by 10 - 14 days and do not include Northern Ireland and Scotland.
Click for national ONS data on deaths (Excel spreadsheet)
The ONS figures are broken down by District providing a glimpse of where deaths are occurring. The provisional cumulative total of COVID related deaths in Worcestershire reported by the ONS up to 5th November 2021 (week 44 of 2021) is shown below.
Note: the numbers are from the ONS Death Registrations-Pivot table
| Districts of Worcs | Deaths 2020 |
Deaths 2021 |
Week 44 | Population |
| Bromsgrove | 164 | 120 | 3 | 98,529 |
| Malvern Hills | 61 | 90 | 1 | 77,545 |
| Redditch | 108 | 96 | 0 | 85,317 |
| Worcester | 87 | 126 | 0 | 103,542 |
| Wychavon | 157 | 141 | 4 | 126,240 |
| Wyre Forest | 171 | 123 | 2 | 100,957 |
| TOTAL | 748 | 696 | 10 | 592,130 |
Provisional cumulative COVID-19 deaths registered by ONS to 5th November 2021
In week 44 there was 1 death in a care home and 1 in hospital in Bromsgrove; 1 death in hospital in the Malvern Hills; 1 death in a hospice and 3 in hospital in Wychavon; and 1 death at home and 1 in hospital in the Wyre Forest.
In England and Wales 990 COVID-19 related deaths were reported in the week to 5th November, 132 more than the week before. Of these 79 were in a care home, 73 at home, 8 in a hospice, 825 in hospital and 5 elsewhere.
Note: summation of rows 9 to 339 of the ONS deaths Registrations-Pivot table.
The provisional UK COVID-19 death toll (as reported by PHE and ONS) for all weeks of the epidemic can be found on the Deaths tab of the Coronavirus Dashboard.
NHS England figures for Worcestershire
The table below shows latest COVID deaths in Worcestershire hospitals reported by NHS England on 19th November 2021.
| Worcestershire | Cumulative deaths | Past week |
| Acute hospitals | 878 | 3 |
| Care hospitals | 64 | 0 |
| TOTAL | 942 | 3 |
Click for NHS COVID-19 total announced deaths
Click for Summary of Malvern numbers on the Coronavirus dashboard
Risk of COVID-19 death by age band
NHS England provides an analysis of COVID-19 deaths in hospital in England and Wales by age band. Shown below is a breakdown of deaths for the period 1st August 2021 to 20th October 2021 when, despite much of the population being protected by the vaccines, particularly the elderly, the death rate rose to about 130 deaths per day.
| Age band | Number of deaths | % of deaths |
| 0 - 19 | 17 | 0.3 |
| 20 - 39 | 116 | 2 |
| 40 - 59 | 708 | 12 |
| 60 - 79 | 2,470 | 42 |
| 80+ | 2,565 | 43 |
Relative risk of COVID-19 death by age band
Those aged 60+ years continue to account for about 85% of deaths, not far from the figure of 92% last year, but remember that due to vaccination the death rate as a proportion of new cases is five to ten times lower than in 2020.
The majority of these deaths are likely to be of the vaccine-hesitant, those with underlying conditions such as Diabetes, the frail, and those that are immuno-compromised. Pregnant mothers, the overweight and deprived individuals with a poor diet are also said to be at increased risk.
An NHS leaflet offered to patients being admitted to hospital suggests we are at higher risk of complications from COVID-19 infection if we have one or more of the following conditions:
-
Age over 70 or Male over 50;
-
Lung problems (including asthma, COPD, emphysema, bronchitis, bronchiectasis;
-
Heart disease
-
Diabetes
-
Chronic kidney disease
-
Liver disease (eg hepatitis, cirrhosis)
-
Brain or nerve problems (eg Parkinson's disease, motor neurone disease, multiple sclerosis, cerebral palsy)
-
You have a condition that increases the risk of infection
-
Take medication that affects the immune system, (eg steroids)
-
Very obese (BMI over 40)
-
Pregnancy
Many COVID deaths are now rumoured to be of the fully vaccinated elderly, but remember that broadly speaking we are ten times more likely to die of something else, so don't be over-concerned.
Healthcare numbers
The UK government Coronavirus Dashboard includes important information about healthcare statistics.
| Hospital COVID cases (UK) | Number | Change since last week |
| Patients currently in hospital | 8,079 | -573 |
| Patients on ventilation | 923 | -76 |
| Patients admitted daily | 881 | -87 |
Headline summary of patients in hospital reported on 21st November 2021
Hospital admissions fell slightly for a second week. The number of hospital beds occupied by COVID patients is now about 20% of the peak last January.
 Worcestershire hospital beds
Tabulated figures for bed occupancy in Worcestershire Acute and Care hospitals can be found on the NHS England website.
Click for NHS England COVID-19 Hospital bed Activity
A summary can be found on the UK government Coronavirus Dashboard which reports on 16th November there were 56 COVID-19 patients occupying Worcestershire Acute Hospital beds, of which 7 were ventilated beds; roughly 21% of the peak experienced last January.
33 patients have been admitted to hospital with coronavirus in the last 7 days, a 46% fall on the previous 7 days.
Note: Healthcare statistics can be found on the Healthcare tab of the UK Coronavirus Dashboard. At the top of the page where it says Healthcare in United Kingdom, click the drop down arrow to select Area Type as NHS Trusts, and Area Name as Worcester Acute Hospitals.
Click to view Worcester healthcare figures
Alternatively,
Click for Summary of Malvern numbers on the Coronavirus dashboard
Forecast for the week ahead
Trends suggest that during the next seven days (up to 28th November) the cumulative total of UK COVID-19 cases reported by PHE on the Coronavirus Dashboard could increase by 300,000 towards 10,145,000 with the 7 day rolling average of daily new cases hovering around 40,000.
In Worcestershire up to 3,000 new cases of COVID-19 can be expected, and 350 cases in the Malvern Hills district.
We estimate the number of UK COVID (28) deaths will increase by about 1,050 towards 145,000 during the 7 days ending 28th November 2021, with the average daily death rate hovering around 150 deaths per day possibly rising towards 160 deaths per day the week after that. These are 'baked in' deaths of those already infected which cannot be avoided.
In the county of Worcestershire, assuming a 0.2% death rate, the 2,944 new cases this week may translate to 6 COVID deaths per week by the middle of December.
We expect the daily number of patients admitted to hospital to reach 950 next week tracking daily cases. Numbers may then fall a bit as the boosters increase the resistance to infection of fully vaccinated Seniors.
Longer term outlook
We must all be hoping to see a gradual downturn in daily hospital admissions and deaths during the next 3 months as those aged 40+ years receive booster jabs, and children are either vaccinated or gain immunity following infection by COVID-19.
The timing of this is uncertain and will greatly depend on the speed and extent of the vaccine rollout; tag on a week or so for the vaccine to take effect, a further week for the increased resistance to infection to impact hospital admissions, and a further two weeks for this to be reflected in the number of daily deaths, then it could be another 4 to 6 weeks before any marked improvement is seen in the figures. Any downturn is likely to coincide with the Christmas and New Year holiday when the reporting of figures is likely to be delayed.
Many commentators had been hoping the epidemic would be 'all but over' by Christmas, but some are now wondering if the 'tail' could extend a further two to three months or possibly even longer.
Updated modelling from University College London now suggests the seven day average of daily deaths will remain at about 150 per day for the next week and then decline slowly, reaching a minimum of about 25 per day in the New Year (later than originally predicted). We are sceptical the death rate will fall so far in the next quarter.
Click for UCL Long-term forecasting of the COVID-19 epidemic
SPI-M models do not rule out a further minor wave of the epidemic next March as the effectiveness of the vaccines wanes and the behaviour of the public returns to 'normal'.
For a fixed level of vaccination, daily cases are a signpost to whether daily hospital admissions and deaths are going to go up or down. Based on our heuristic 'rules of thumb' - based on autumn figures, hospital admissions, cases of Long COVID and deaths were expected to follow daily cases roughly in the ratio:
-
Hospital admissions 1:35 of daily cases reported by PHE, lagging by 8 days.
-
Long COVID 1:35 of daily cases reported by PHE.
-
Deaths 1:350 of daily cases reported by PHE, lagging by about 20 days.
-
UK Hospital bed occupancy - one quarter of daily cases, lagging by up to a month.
During October when a significant proportion of cases involved schoolchildren, most of whom would not fall seriously ill, these ratios were expected to over-estimate admissions and deaths.
However contrary to expectations daily deaths seemed to worsen to 1:250 of daily cases notified by PHE.
Three factors may have contributed to this:
-
the virus is weeding out the unvaccinated who are becoming increasingly complacent and no longer wearing masks and distancing;
-
a greater proportion of people are not bothering to record their positive Lateral Flow tests, so cases are under reported;
-
the protection offered by the vaccines was waning.
Now boosters are being rolled out a significant improvement in these ratios should be observed in the next month or so.
Advice for Seniors
 Recently
there have been no more than 10 COVID related deaths per week in Worcestershire
which has a population of 600,000 so we judge the
risk of death for fully vaccinated
Seniors to be
fairly
LOW while the risk of Long COVID might be MODERATE;
see our annex and riskometer opposite.
Recently
there have been no more than 10 COVID related deaths per week in Worcestershire
which has a population of 600,000 so we judge the
risk of death for fully vaccinated
Seniors to be
fairly
LOW while the risk of Long COVID might be MODERATE;
see our annex and riskometer opposite.
Remember, if you are elderly, have not been vaccinated, and were to catch COVID there is a significant chance that you will either die or your long term health may be seriously damaged, so if you are able get both doses of your vaccine and your booster and continue to take care of yourself and those you love. Also encourage others to be vaccinated.
Click for our risk of death table (for those who have not been vaccinated)
Like Health Minister Sajid Javid and Sir Kier Starmer, it is quite possible, despite a second jab, for Seniors to become ill with COVID-19; some might have mild symptoms like a common cold or hay fever, while others could feel very poorly, but few except the frail, vulnerable, and unlucky will need to be admitted to hospital.
Those that have been triple jabbed and are in generally good health may now feel no need for COVID precautions.
Until daily cases fall markedly, the simple safeguards for the remaining more vulnerable to remember are to:
-
get your booster vaccine six months after your second jab; don't worry if you have to wait a week or two to get an appointment; two weeks after the booster most people should be well protected.
-
wash your HANDS thoroughly, using soap and hot water, for 20 seconds, including after handling deliveries to your home, to kill virus picked up from contaminated surfaces see note 1;
-
wear a FACE covering when unavoidably near other people for example when shopping, visiting hospital or the chemist, and using public transport;
-
SPACE at least 2 metres from people you don't feel safe with see note 2;
-
preferably socialise with friends and other households outdoors in the FRESH AIR else, if you are indoors, either ventilate by keeping windows open as far as is practicable or put a HEPA air purifier in the room;
-
avoid crowded indoor settings and minimise TIME near strangers;
-
self-isolate and take a test if you feel unwell with cold or flu like symptoms; according to the Zoe COVID Study the top five symptoms amongst the double vaccinated and children, in order of prevalence, are said to be headache (73%), runny nose (73%), sneezing (59%), sore throat (53%), and cough (49%), which are often hard to distinguish from a common cold - you might alternatively suffer from fever with a temperature of up to 103 deg F, and a reduction in sense of taste.
-
respect others and give them space.
Notes:
1) Wash your hands thoroughly before touching your face to avoid transferring virus from contaminated surfaces to your mouth, eyes and nose. If outdoors use an alcohol based hand gel.
2) Two metres is further than you think - roughly an arm and a walking stick away.
Annex to 21st November update
Commentary
How quickly might COVID cases fall in the UK
About 6 weeks ago a commentator on the radio suggested we had already moved from the pandemic to endemic stage and should expect of the order of 40,000 new cases per day in the UK for the foreseeable future. At the time we thought that a rather pessimistic outlook, but with cases hovering around 35,000 for the last 4 months is he right?
A disease become endemic when it cannot be eliminated and the level is one the public is prepared to tolerate. It seems the British public have got used to hearing about 35,000 new COVID cases, 800 or so hospital admissions, and 150 deaths per day.
So what will happen next? We assume the virus is currently weeding out pools of the unvaccinated, and infecting the frail and unlucky for whom the vaccines do not work well.
Currently about 66% of new cases are unvaccinated, so were that group eliminated we might still be left with 10,000 new cases and 50 deaths per day.
33% of the total UK population is unvaccinated, about 22M, of which say 8M are under 12 years, leaving up to 14M still unprotected, though some of course will have caught COVID. If the infection rate in that group is assumed 20,000 cases per day and cases fall exponentially then it could take roughly a year for cases to fall by half.
So a back of the envelope worst case scenario could be the present long term average of 35,000 new cases per day falls to about 20,000 cases per day (10,000 vaccinated+10,000 unvaccinated) in a years time, then to 15,000 a day (10,000 vaccinated + 5,000 unvaccinated) in two years time and towards 10,000 per day in three years time.
The booster programme, the summer when people spend more time outdoors, recurrent COVID infections, and annual COVID vaccinations will significantly modulate this curve, but if herd immunity is not achieved as many think, the vaccine-hesitant continue to refuse the vaccine, and children under 12 years are not immunised, then do not be too surprised if it takes a further year or so for COVID to drop to 25% of the present level.
Now in comparison, in Israel the surge in cases in the autumn fell to 25% over a period of just 4 weeks. That was achieved by a combination of booster jabs and restrictions on the lines of the UK government's PLAN B. Of course our PM has chosen not to implement PLAN B in the UK, and we are now heading for mid-winter when more time is spent indoors. Further, families will be criss-crossing the UK during the Christmas holiday. So the Effective R value in the UK will be suppressed less than in Israel, and consequently cases in the UK are certain to fall more slowly.
This week
On Monday the Prime Minister held a Number 10 Coronavirus Press Conference exhorting the public to get fully vaccinated.
Click for PM's press statement on 15th November
He announced, following JCVI advice, second jabs would be made available to all 16 and 17 year olds from 12 weeks after their first dose, and boosters would become available to all those aged 40 to 49 from six months after their second dose - and probably that will be in a month or two, so don't bother your GP surgery just yet.
Click to watch 15th November Press Conference on Youtube
Malvern Civic Society advised members who had attended the AGM last Friday to get tested as one of the attendees tested COVID positive.
The BBC reported a lockdown for the unvaccinated was to be introduced in Austria due to rising cases.
On Tuesday Radio 5 carried a report about ambulance delays in Wales which reminded us that you may have to wait several hours for an ambulance in Malvern if you have had a fall and can't get up.
Tighter COVID restrictions were imposed in the Republic of Ireland
On Wednesday another member of the family reported testing COVID positive despite being fully vaccinated. No classic symptoms apart from a temperature of 103 deg F, mild intermittent cough and slight loss of taste.
We had our Pfizer booster jabs at Prospect View; no side effects other than sore arm, tiredness and mild headache the next day. Friends have reported side effects ranging from a sore arm to feeling groggy for a day or two, so be prepared for this.
On Sunday the media reported unrest in Austria, Belgium and the Netherlands due to restrictions imposed to dampen escalating cases of COVID-19. The consensus seems to be Europe is lagging the UK so the rise across the channel is nothing for us to worry about.
COVID video updates
The usual charts showing vaccination take-up and COVID cases over time by age band can be found in the Zoe COVID Study and Independent SAGE weekly updates. Dr John Campbell expresses disappointment that herd immunity is unlikely to be achieved and in a second video mentions the need to wait 3 months after getting COVID before being vaccinated.
All in all there is not much new in this week's updates.
Click to watch Tim Spector's Zoe COVID Study 17th November video update
The Independent SAGE weekly briefing includes mention of climate change.
Click to watch Independent SAGE 19th November video briefing
Click to read more about Independent SAGE on Twitter
Dr John Campbell talks about the lack of herd immunity on 15th November,
Click to watch Dr John Campbell's 15th November video
In another video dated 18th November he talks about the situation in Europe and waiting 3 months after catching COVID before getting jabbed.
Click to watch Dr John Campbell's 18th November video
U3A
Malvern U3A groups have resumed. Some groups are continuing to meet using Zoom while others are meeting in person.
Members are being asked not to attend meetings if feeling unwell. Names will be taken at meetings and could be passed to NHS Test and Trace if a member subsequently tests COVID positive. Refreshments are being provided by some groups but not others.
Overseas travel
From 24th October travellers arriving from abroad need only take a Lateral Flow Test.
Travel to other countries seems to be gradually opening up.
List of vaccines (unchanged)
Here is the updated list of COVID-19 vaccines ordered by the UK. It looks as though the government has settled on Pfizer as first choice with Moderna second and Astrazeneca now held in reserve.
Valneva has been cancelled, and approval has not yet been sought for using Novavax in the EU and US although approval has been sought for use in third world countries.
For two doses plus boosters, only about 200M doses will be needed for the population of the UK, so it's possible the government will cancel orders for those vaccines marked in red which have been slow to come to market.
| COVID-19 vaccine | Doses ordered (million) | Status |
| Pfizer BioNTech, two dose, -70 deg C | 40+60+35 | Approved, deliveries continuing, made in Belgium (EU). An additional 60M doses have been ordered for booster shots for the most vulnerable in the autumn. A further 35M doses were ordered in August 2021 for delivery in 2022. |
| Astrazeneca, two dose, fridge | 100 | Approved for those aged 30+ years; deliveries continuing. Batches made in UK, Belgium and India. |
| Moderna, two dose, -20 deg C | 7+10 | Approved. First deliveries to Wales and Scotland 7th April 2021 then England 13th April; mainly for those aged under 50 years awaiting vaccination. |
| Valneva, two dose | 60+40 order cancelled |
A jab from French company Valneva will be made in Livingston, West Lothian, Scotland. Order cancelled September 2021. Delivery had been expected to start in second half of 2021. |
| Janssen, single dose | 20 | Approved, a jab from Belgian firm Janssen, owned by Johnson and Johnson; UK approval 28th May. Order reduced from 30 to 20M. |
| Novavax | 60 ? | A jab manufactured by US firm Novavax being made in Stockton-on-Tees UK; phase III trials complete, but approval has not yet been sought in EU and US. Glaxo Smith Kline (GSK) contracted to fill and package vials. |
| GSK Sanofi | 60 ? | Some delay due to adjusting the formula to give better protection to the elderly; possible approval 2022. |
| Curevac | 50 ? | Contract placed with German company Feb 2021. Possible source of new variant vaccine, but disappointing trial results. Future uncertain. |
Table of vaccines ordered by the UK government
Present rate of new cases and risk
The average rate of infection per 100,000 population per week in England has risen to 409 while in comparison the figure for Worcestershire is 447 and the Malvern Hills 391.
In Wales the case rate has risen to 536, whereas in Scotland the rate is 384.
As a yardstick we suggest a figure of below 10 can be considered LOW, so there is a long way to go.
The probability of fully vaccinated Seniors, without underlying conditions, catching and dying from COVID-19 is now possibly somewhere in the range 1 in 1,000 to 1 in 10,000 per year so we judge the risk fairly LOW compared to the risk of dying from other causes. Perhaps as many as 3% to 5% of people who catch COVID suffer from Long COVID so that risk might be assessed MODERATE.
The risk of death from Coronavirus for unvaccinated children and healthy teenagers is said to be small so for them the risk is LOW.
About the UK COVID-19 final death toll
The UK is probably going to have to live with COVID-19 and a background level of infection which may increase every winter as more time is spent indoors. Barring new variants, this could result in many thousands of COVID deaths per year, as with flu. So in that respect there can be no 'final' death toll.
The present 2020/2021 death toll will likely climb from 144,000 towards 150,000 by Christmas 2021 based on the PHE definition of deaths. If ONS figures are used the UK toll could be heading towards 205,000 or perhaps even a tad higher.
Worldwide, this pandemic is not played out and it could be a further 2 to 3 years before the 'dust' finally settles and third world countries are vaccinated. The PM has promised an independent inquiry in Spring 2022 to learn lessons for the future.
At the start of the epidemic on 17th March 2020 the Chief Scientific Adviser, Sir Patrick Valance, questioned by the Health Select Committee, did not disagree with Jeremy Hunt's suggestion that a death toll of 20,000 might be a reasonable outcome.
On the other hand, Professor Neil Ferguson of Imperial College warned in some scenarios the death toll might be as high as 250,000; while we thought, in the very worst case assuming up to 1% of the UK population died the outcome might have been nearer 400,000 taking into account some build up of herd immunity.
So how well will the UK have done? When Jeremy Hunt and Sir Patrick Valance spoke there had been few deaths and they clearly underestimated what was to come. Professor Neil Ferguson was nearest the mark. A few might consider an outcome of about 150,000 deaths during 2020 and 2021 a fair result compared to a greater number of people dying in a very short space of time, more being permanently disabled by Long COVID, temporary collapse of the NHS and patients dying at home or queued in ambulances outside hospitals. You have only to look at the recent situation in India to imagine what could have happened.
Many others will no doubt say the UK has done poorly compared to the best performing countries such as New Zealand and Singapore where deaths have been much lower, not to mention the enormous expense of supporting those out of work and huge damage to the economy.
With hindsight, deaths might have been much lower if the second lockdown had been continued into December and January, but that would have meant cancelling Christmas, and who knows to what extent the public would have complied.
A member of the marketing team at US company 'My Bio Source' sent us a link to a History of Pandemics. Let's hope our brilliant scientists can continue to protect us from future threats.
Summary of Links
Symptoms
Article about the effects of Coronavirus on the human body
Reporting and how to obtain a test
How to get a test
https://www.nhs.uk/coronavirus
About joining the Zoe COVID Symptom Study:
Guidance
UK government Coronavirus guidance
COVID-19 Response: Autumn and Winter Plan 2021 for England
COVID Alert states
Guidance on UK COVID-19 alert level methodology: an overview
COVID-19 Alert Level lowered to 3 on 10th May 2021
Tiers
Guidance on tiers: what you need to know
Government postcode checker to find tier for other areas
Statistics
UK government Coronavirus Dashboard
Coronavirus Dashboard Interactive Map
ONS data on deaths in England and Wales (Excel spreadsheet)
NHS England COVID-19 Daily Deaths
NHS England COVID-19 Hospital Admissions
NHS England vaccination statistics
Worcestershire Coronavirus Dashboard
Worcestershire COVID-19 Vaccinations Dashboard
HSA COVID-19 vaccine weekly surveillance reports
A glimpse of the worldwide vaccination situation can be found on the Our World in Data website.
Click for chart showing % vaccinated
Modelling
A forecast of the progression of the COVID-19 epidemic can be found on a University College London (UCL) website.
Click for UCL Long-term forecasting of the COVID-19 epidemic
A projection of the future COVID-19 death toll and daily deaths can be found on The Institute for Health Metrics and Evaluation website.
Click for IHME projection of COVID-19 deaths
Reports
ONS Coronavirus (COVID-19) Roundup
The bigger picture
Worldometer summary of coronavirus cases worldwide
European Centre for Disease Prevention and Control info
https://www.ecdc.europa.eu/en/geographical-distribution-2019-ncov-cases
World Health Organisation info
Window on the USA
Centre for Disease Control (CDC)
American Association of Retired People (AARP)
Worcestershire
Help:
http://www.worcestershire.gov.uk/here2help
Worcestershire County Council COVID-19 information:
http://www.worcestershire.gov.uk/coronavirus
Here you will find a useful link,
'Website: Number of new cases by date in Worcestershire'
which displays interesting COVID charts and statistics for Worcestershire
Miscellaneous
Spanish Flu
Dr Jeff Kildea's commentary about the 1919 outbreak of Spanish Flu in Australia
Views of Martin McKee, Professor of European Public Health
Follow Martin McKee on Twitter
SAGE membership
Scientific Advisory Group for Emergencies (SAGE)
Scottish government:
Link to Scottish Government website
Link to Postcode checker for COVID restrictions by protection level in areas of Scotland
Welsh Government:
Guidance on COVID alert levels in Wales
![]()
The interpretations and opinions expressed are our own
Last updated 22nd November 2021