Angus and Rosemary's Miscellany
of Malvern - Other Resources
|
Coronavirus (COVID-19) epidemic weekly update for Malvern Seniors16th January 2022 DAILY CASES FALLING Pressure on hospitals slackening Restrictions could soon be relaxed PreambleWe keep an eye on the published government figures and monitor the media to asses the level of risk for Seniors in the Malvern Hills district. We also provide links to where further information can be found. This page is normally updated every Sunday between 1800 and 2400 hours GMT. Information about Coronavirus can be found on the NHS website: https://www.nhs.uk/coronavirus ContentsFurther information: About the Zoe COVID symptom study About the NHS contact tracing app SummaryThe incidence of Omicron is still high across the whole of the UK and many people will be exposed to the virus in coming days and weeks, but daily cases have begun falling, and the pressure on hospitals is slackening. The daily death rate has however been rising since the New Year suggesting the Omicron variant of COVID-19 has a sting in its tail. Boosted Seniors are catching the virus and suffering from symptoms some weeks later. However two doses of the vaccine plus the booster jab should protect most healthy individuals from hospitalisation. Continue to take care as it appears the vaccines give little protection from becoming infected. Lateral Flow Device kits which only require a nose swab can be used to test for COVID at home, for example before either going to an event or visiting friends. A local summary of COVID cases can be found on the Worcestershire Coronavirus Dashboard. Note: use the arrow <> buttons at the bottom of the Dashboard screen to move between pages. Click for Worcestershire County Council COVID-19 news Click for Simple Summary of Malvern numbers on the Coronavirus dashboard Click for the latest UK Government Coronavirus advice
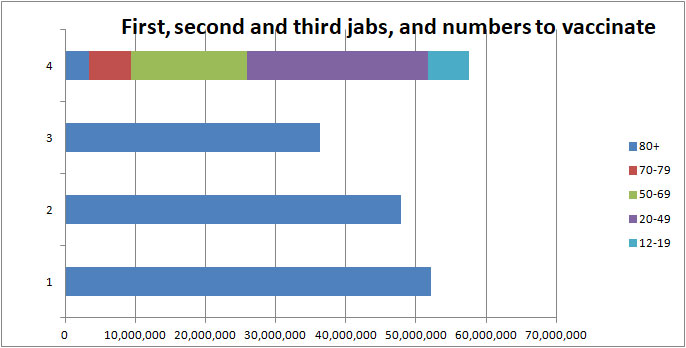
How to get vaccinatedThe most important thing everyone can do now is get their booster jab. Under the government's plan to deal with the Omicron Emergency, all those aged 16+ years are now eligible to book a booster 3 months after their second dose. For information about walk-in centres in Worcestershire go to the website: and click the Vaccine Rollout tab at the top of the page. Click for information about vaccination at the Three Counties Showground Otherwise either see the NHS website for walk-in opening times and vaccine availability: Or click this link for more information and to book a vaccination on-line: Book a Coronavirus vaccination - NHS (www.nhs.uk) Note: the immuno-compromised may be offered a third jab as part of their primary course, followed by a booster 3 months later. More about vaccinationsPlanOn the 19th November 2021 the JCVI issued recommendations accepted in Parliament by Sajid Javid. The plan was to vaccinate fully as many people as possible before the Omicron variant became dominant in the UK Good progress was made in December, but worryingly vaccination rates have since slowed considerably which we put down to both complacency and a reduction in government advertising. The Omicron variant is now dominant and still spreading rapidly. Despite what some say it's not a mild illness so there is good reason to get your booster jab in January if you have not already done so. VaccinometerOur bar chart below shows the total number of:
Vaccinometer as of 16th January 2022 You won't see much change from last week's chart as the vaccination rate has slowed to a snail's pace since the New Year, compared to pre-Christmas. The population of the UK aged 12+ is about 58M, so were everyone in that age group to be fully vaccinated the lower two blue lines showing 1st and 2nd doses should ideally reach 58M. Progress towards that goal is now slow. Currently there are about 6M in this age group who are unvaccinated, which is a lot, and 4M still to get their 2nd dose. If children aged 11 years and under are counted, the total population of the UK is roughly 66M. Click for NHS video warning young people of the dangers of the virus for the unvaccinated. Vaccination statistics can be found on the Vaccination tab of the Coronavirus Dashboard. Vaccination of childrenThe following table shows the percentage of first doses in children in the UK.
Source: Independent SAGE 7th January 2022 Booster jabsThe number of booster jabs given in England can be found in a spreadsheet on the NHS England website. Look in the data section for the COVID-19 daily announced vaccinations Excel file which gives a breakdown of jabs by region and age. Click for NHS COVID-19 vaccinations A summary can also be found on the Coronavirus Dashboard. The government says everyone aged 18+ years has been offered a booster jab. To date about 48M have had two doses, and just over 36M booster doses have been administered, suggesting up to 12M still to boost in the UK. Vaccinations WorldwideA chart of the worldwide vaccination situation can be found on the Our World in Data website. Click for worldwide statistics Note: click the country list on the left hand side of the screen to add or remove countries from the chart. The UK did well to start with but has fallen a little behind some other countries. For example Portugal has double vaccinated 89.8% of its population, Singapore 87.0% and Malaysia 78.2%, compared to 69.8% in the UK. Australia has overtaken the UK with 77.1% fully vaccinated and could soon open its borders to the fully vaccinated. Israel has already boosted its population and is now trialing a second booster for those boosted more than 4 months ago. The UK government does not seem to be considering a programme of second booster shots at the moment.
|
| Districts of Worcs | Cases | Weekly increase | Population |
| Bromsgrove | 23,384 | +1,259 | 98,529 |
| Malvern Hills | 11,457 | +580 | 77,545 |
| Redditch | 20,204 | +1,081 | 85,317 |
| Worcester | 21,529 | +1,256 | 103,542 |
| Wychavon | 23,654 | +1,275 | 126,240 |
| Wyre Forest | 20,895 | +1,412 | 100,957 |
| TOTAL | 121,213 | +6,783 | 592,130 |
| COMPARE WITH | |||
| County of Hereford | 32,016 | +1,819 | 195,000 |
| Leicester (city of) | 92,083 | +4,925 | 400,000 |
Cumulative cases reported by PHE in Worcestershire to 16th January 2022
Note: the weekly increase is indicative; the seven day average by area, which varies day to day, is an alternative metric that can be found on the Coronavirus dashboard.
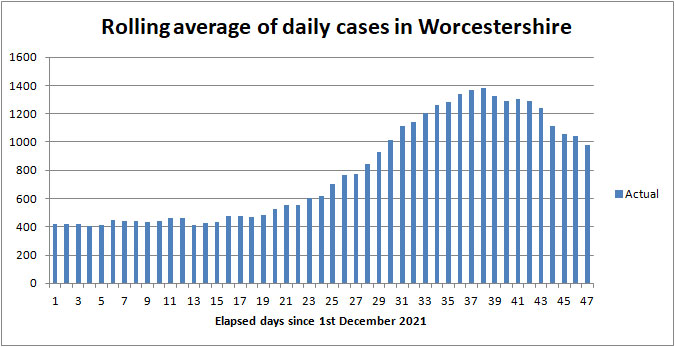
New daily cases for Worcestershire are down 25% on last week.
Cases in Malvern Hills by age group
On the cases tab of the Coronavirus dashboard you can either select the county of Worcestershire or a local authority such as the Malvern Hills, and there you can find a heat map showing cases by age group over time and a chart comparing the number of cases under 60 years with those aged 60+.
The latest figures show the infection rate in both age groups falling with cases in the younger age group double that of the older.
The rolling number of cases per 100,000 per week reported for 10th January has fallen slightly to 580 in the over 60s and 1,246 in those aged 0 - 59 years.
Click for cases by specimen date age demographics in the Malvern Hills
Interactive maps
At the bottom of the Coronavirus Dashboard (daily update) page there is an Interactive Map which is coloured to show infection rates across the country. This shows the high infection rates across the UK are falling in most areas (less so in the north of England).
Click for Interactive Map of COVID cases
Note: the Interactive Map works on desktop PCs but it's possible you may encounter difficulties using a tablet or smartphone.
Recent weekly cases to 10th January are: North Malvern 72; Malvern Link 65; Pickersleigh 87; Barnards Green 54; Malvern Wells and Priory 63; Callow End and Hanley 42; Upton and Welland 84.
Another map can be found on the Zoe COVID Study website indicating extrapolated cases based on reports from those using the Zoe app.
Click for People with COVID (estimated from the Zoe app)
Number of deaths
Statistics on COVID deaths are published by Public Health England, The Office of National Statistics, and NHS England.
 PHE figures
Public Health England reports that the cumulative total of COVID (28) deaths in UK hospitals and care homes rose by 1,833 in the last week to 151,987 with the daily average rising from 186 to 262.
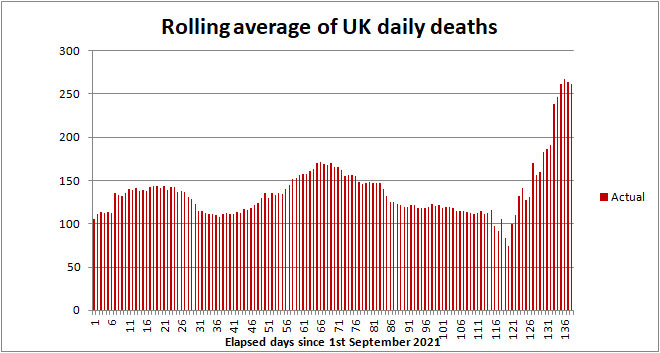
COVID-19 death rate 1st September 2021 to 16th January 2022
Click to view the UK government Coronavirus Dashboard
The steep upturn in deaths since Christmas remains to be explained.
Since England emerged from lockdown on 19th July about 23,000 people have died of COVID-19; mostly the elderly.
In comparison averaged over recent years 1,700 people die daily from all causes, so COVID deaths currently account for about 15% a not insignificant number.
ONS figures
The Office of National Statistics (ONS) separately reports registered deaths in England and Wales where COVID-19 is mentioned on the death certificate. The ONS figures lag the PHE figures by 10 - 14 days and do not include Northern Ireland and Scotland.
Click for national ONS data on deaths (Excel spreadsheet)
The ONS figures are broken down by District providing a glimpse of where deaths are occurring. The provisional cumulative total of COVID related deaths in Worcestershire reported by the ONS up to 31st December 2021 (week 52 of 2021) is shown below.
Note: the numbers are from the ONS Death Registrations-Pivot table
| Districts of Worcs | Deaths 2020 |
Deaths 2021 |
Week 52 | Population |
| Bromsgrove | 164 | 142 | 1 | 98,529 |
| Malvern Hills | 61 | 98 | 0 | 77,545 |
| Redditch | 108 | 109 | 2 | 85,317 |
| Worcester | 87 | 134 | 0 | 103,542 |
| Wychavon | 157 | 154 | 1 | 126,240 |
| Wyre Forest | 171 | 132 | 1 | 100,957 |
| TOTAL | 748 | 769 | 5 | 592,130 |
Provisional cumulative COVID-19 deaths registered by ONS to 31st December 2021
Note: summation of rows 9 to 339 of the ONS deaths Registrations-Pivot table (after correction by ONS).
There was 1 death in hospital in Bromsgrove; 1 death at home and 1 in hospital in Redditch; 1 death in hospital in Wychavon; and 1 death in hospital in Wyre Forest.
In England and Wales 581 COVID-19 related deaths were reported in the week to 31st December, 172 less than the week before. Of these 46 were in a care home, 58 at home, 17 in a hospice, 456 in hospital and 4 elsewhere.
90% of these deaths were probably due the Delta variant.
Note: the significant drop on last week may be partly explained by delayed reporting over the Christmas and New Year holiday. If so, the number of deaths reported in week 1 of 2022 could appear high due to inclusion of delayed registrations from 2021.
The provisional UK COVID-19 death toll (as reported by PHE and ONS) for all weeks of the epidemic can be found on the Deaths tab of the Coronavirus Dashboard.
NHS England figures for Worcestershire
The table below shows latest COVID deaths in Worcestershire hospitals reported by NHS England on 14th January 2022.
| Worcestershire | Cumulative deaths | Past week |
| Acute hospitals | 918 | 3 |
| Care hospitals | 64 | 0 |
| TOTAL | 982 | 3 |
Click for NHS COVID-19 total announced deaths
Click for Summary of Malvern numbers on the Coronavirus dashboard
Risk of COVID-19 death by age band (Delta)
NHS England provides an analysis of COVID-19 deaths in hospital in England and Wales by age band. Shown below is a breakdown of deaths for the period 1st August 2021 to 25th November 2021 when the daily death rate fell to 125.
| Age band | Number of Delta deaths | % of deaths |
| 0 - 19 | 29 | 0.3 |
| 20 - 39 | 157 | 2 |
| 40 - 59 | 1,058 | 11 |
| 60 - 79 | 4,062 | 43 |
| 80+ | 4,134 | 44 |
Relative risk of COVID-19 death by age band for Delta variant
Those aged 60+ years account for 87% of deaths compared to 92% last year, but remember that due to vaccination the death rate as a proportion of new cases is five to ten times lower than in 2020.
The majority of these deaths are likely to be of the vaccine-hesitant, those with underlying conditions such as Diabetes, the frail, and those that are immuno-compromised. Pregnant mothers, the overweight and deprived individuals with a poor diet are also said to be at increased risk.
An NHS leaflet offered to patients being admitted to hospital suggests we are at higher risk of complications from COVID-19 infection if we have one or more of the following conditions:
-
Age over 70 or Male over 50;
-
Lung problems (including asthma, COPD, emphysema, bronchitis, bronchiectasis;
-
Heart disease
-
Diabetes
-
Chronic kidney disease
-
Liver disease (eg hepatitis, cirrhosis)
-
Brain or nerve problems (eg Parkinson's disease, motor neurone disease, multiple sclerosis, cerebral palsy)
-
You have a condition that increases the risk of infection
-
Take medication that affects the immune system, (eg steroids)
-
Very obese (BMI over 40)
-
Pregnancy
Note: we hope to be able to add data for Omicron by the end of January.
Healthcare numbers
The UK government Coronavirus Dashboard includes important information about healthcare statistics and NHS bed occupancy.
| Hospital COVID cases (UK) | Number | Change since last week |
| Patients currently in hospital | 19,539 | +1,085 |
| Patients on ventilation | 777 | -91 |
| Patients admitted daily | 2,423 | -11 |
Headline summary of patients in hospital reported on 16th January 2022
Bed numbers are up a little but should soon begin to fall now cases are dropping (see below).
The number of hospital beds occupied by COVID patients is now about 50% of the peak last January.
Bed numbers by region in England
Tabulated figures for COVID bed occupancy in England can be found on the NHS England website and these give a good indication of direction of travel:
Click for NHS England COVID-19 Hospital bed Activity statistics
Note: see the latest Daily Admissions and Beds spreadsheets, then look for all COVID beds.
| Region | 7th January 2022 | 14th January 2022 | 15th January 2021 |
| London | 3,989 | 3,572 | 7,811 |
| Midlands | 2,943 | 3,085 | 5,890 |
Comparison of All beds COVID data for London and Midlands
In the last week the number of COVID-19 General and Acute beds fell by 10% in London, where Omicron seeded first, while in the Midlands COVID beds rose 5%.
For the same period, COVID beds in England rose from 16,163 to 16,537 an increase of just 2%. Trends suggest the number of COVID beds occupied will either flat-line or begin to fall next week.
For comparison, the number of beds occupied during the peak of the epidemic last January is shown in red in the right hand column.
Some COVID beds are said to be occupied by patients who either came into hospital for other reasons or caught COVID in hospital - these patients are mostly not ill with COVID but have to be allocated a COVID bed after testing positive.
Worcestershire hospital beds
Tabulated figures for bed occupancy in Worcestershire Acute and Care hospitals can also be found on the NHS England website.
A summary can be found on the UK government Coronavirus Dashboard which reports on 11th January there were 75 COVID-19 patients occupying Worcestershire Acute Hospital beds, of which 5 are ventilated beds; roughly 28% of the peak experienced last January and 4 higher than last week.
COVID beds should soon begin to fall following the drop in daily cases in Worcestershire.
Note: Healthcare statistics can be found on the Healthcare tab of the UK Coronavirus Dashboard. At the top of the page where it says Healthcare in United Kingdom, click the drop down arrow to select Area Type as NHS Trusts, and Area Name as Worcester Acute Hospitals.
Click to view Worcester healthcare figures
Alternatively,
Click for Summary of Malvern numbers on the Coronavirus dashboard
Forecast for the week ahead
Trends suggest that during the next seven days (up to 23rd January) the cumulative total of UK COVID-19 cases reported by PHE on the Coronavirus Dashboard could increase by a further 560K towards 15,750K with the 7 day rolling average of daily new cases falling from 107K towards 55K by the end of next week.
In Worcestershire about 6,000 new cases of the Omicron COVID-19 variant can be expected, and up to 500 cases in the Malvern Hills district.
The number of UK COVID (28) deaths may increase by 2,000 towards 154,000 during the 7 days ending 23rd January 2022, with the average daily death rate flat-lining at about 300 deaths per day before falling to 200 deaths per day the week after that.
In the county of Worcestershire, assuming a 0.2% death rate, the 6,783 new cases this week could translate to a maximum of 13 COVID deaths per week by the middle of February, but possibly fewer if the Omicron variant is found to cause less severe illness than Delta.
Daily hospital admissions are expected to fall by 40% towards 1,500 by the end of next week.
Longer term outlook
Daily cases
A month ago we made a simple back of the envelope calculation assuming cases follow a simple S-shaped Logistic Curve roughly matched to the rise in cases of Omicron in order to provide an order of magnitude estimate of what might happen during January and when cases might peak.
With this function, numbers rise exponentially at first, then progressively slow down as the number of individuals left to infect reduces. The number of daily cases is the derivative or slope of the curve which can be easily calculated using an Excel spreadsheet.
We optimistically assumed the whole population had been booster vaccinated and that 75% were protected from symptomatic illness.
The limiting value of cases has been further adjusted to take account of recent numbers and the levelling off of daily cases
The next chart illustrates how daily cases could fall, up
to the end of January, though there is no
guarantee this will happen.
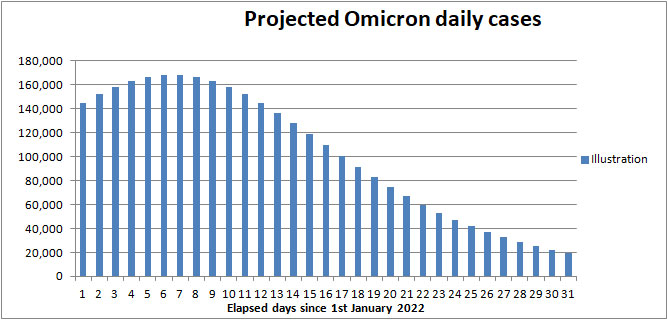
Illustration of possible peak in UK Omicron daily cases
Daily hospital admissions
The next chart is a projection of daily hospital admissions, assuming 1.8% of cases, delayed by 10 days, showing admissions have probably peaked and should now begin to fall.
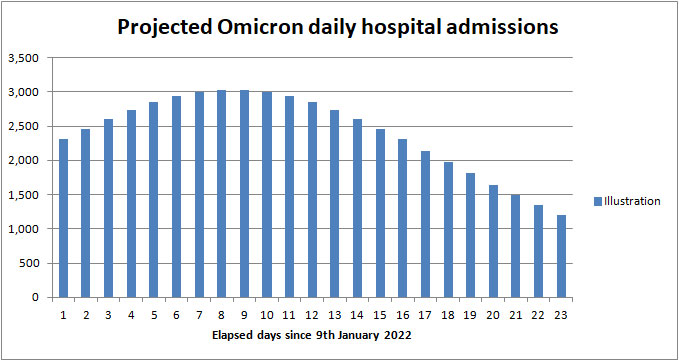
Illustration of Omicron UK daily hospital admissions
Deaths
Our illustration for the daily death rate assumes deaths are 0.2% of daily cases delayed by 15 days after testing COVID positive.
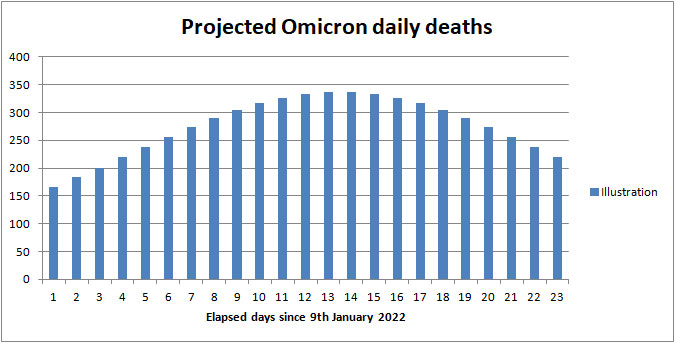
Illustration of possible Omicron daily deaths in UK
The illustration suggests deaths could possibly rise to a peak of about 330 deaths per day towards the end of January and thereon should fall.
Note of caution: so far Omicron has been circulating mostly in those aged under 35 years, so we have yet to see how Omicron affects the elderly. Preliminary data from the USA suggests the death rate from Omicron is lower than that from Delta due to both increased vaccination and symptoms being a little less severe, but so far that does not seem to be reflected in the UK death rate.
Ratios
For a fixed level of vaccination, daily cases have been a signpost to whether daily hospital admissions and deaths are going to go up or down. Based on our heuristic 'rules of thumb' hospital admissions and deaths during early January appear to be to following daily cases very roughly in the ratio:
-
Hospital admissions 1:75 of daily cases reported by PHE, lagging by 7 days.
-
Deaths 0.18% of daily cases reported by PHE, lagging by 15 days.
-
UK Hospital bed occupancy - 8 times daily hospital admissions, lagging by about a fortnight.
Hospital admissions will now all be cases of Omicron, while deaths could still be a mixture of Omicron and Delta.
Advice for Seniors
We judge the risk of exposure to the Omicron variant still to be HIGH; see our riskometer opposite.
How this affects you will depend on your vaccination status. UKHSA say those who have had two doses plus a booster have roughly a 12% chance of being hospitalised compared to the unvaccinated.
6M people remain unvaccinated in the UK and for many time is running out; perhaps 6,000 will die unnecessarily in coming weeks.
Recently there have been no more than 5 COVID related deaths per week in Worcestershire which has a population of 600,000 so we currently judge the risk of death for triple vaccinated Seniors to be fairly LOW while the risk of Long COVID might be MODERATE .
In these uncertain times, when it is quite possible, despite being triple vaccinated, for Seniors to become ill with the Omicron variant of COVID-19, the simple safeguards to remember are to:
-
book your booster dose as soon as you are contacted by either your GP or the NHS; between five days and two weeks after the booster most people should be well protected from severe illness;
-
don't forget your flu jab;
-
wash your HANDS thoroughly, using soap and hot water, for 20 seconds, including after handling deliveries to your home, to kill virus picked up from contaminated surfaces (see note 1);
-
wear either a well fitting FACE covering, FFP2, or N95 face mask when unavoidably near other people for example when in shops, health-care settings, and when using public transport;
-
SPACE at least 2 metres from people you don't feel safe with (see note 2);
-
preferably socialise with friends and other households outdoors in the FRESH AIR else, if you are indoors, either ventilate by keeping windows open as far as is practicable or put a HEPA air purifier in the room;
-
avoid crowded indoor settings and minimise TIME near strangers;
-
self-isolate and take a Lateral Flow test if you feel unwell with cold or flu like symptoms; according to the Zoe COVID Study the current top five symptoms amongst the double vaccinated and children, in order of prevalence, are said to be runny nose, headache, sneezing, sore throat, and persistent cough, which are often hard to distinguish from a common cold - you might alternatively suffer from fever with a temperature of up to 103 deg F, and a slight reduction in sense of taste;
-
consider taking a Lateral Flow test before visiting others (see note 3);
-
respect others and give them space.
Notes:
1) Wash your hands thoroughly before touching your face to avoid transferring virus from contaminated surfaces to your mouth, eyes and nose. If outdoors use an alcohol based hand gel.
2) Two metres is further than you think - roughly an arm and a walking stick away.
3) The COVID Symptom Study people suggest that if you have symptoms of a common cold there is currently a 50% chance you might have COVID.
Annex
Commentary
Little to report this week, as we waited to see if daily cases would dip, and they did.
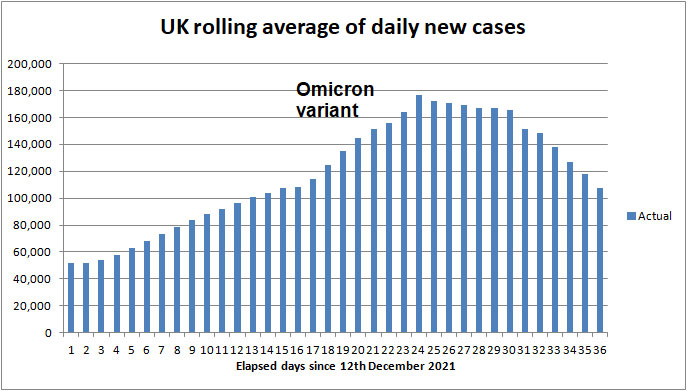
The next chart compares daily cases since 12th December 2021 in red, as Omicron overtook Delta, with our latest projection of future cases in blue.
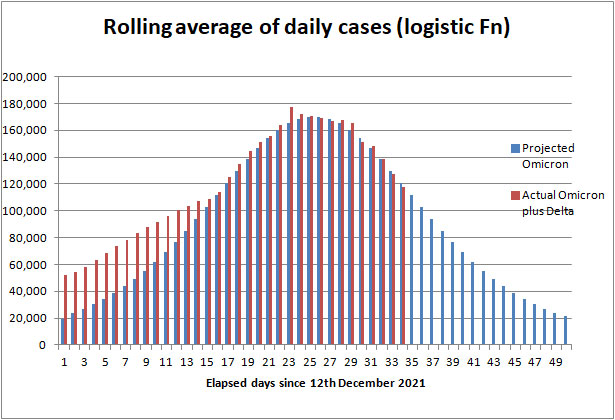
Actual and forecast UK daily cases to the end of January 2022
For several weeks there has been talk of COVID-19 becoming endemic and that is discussed in the latest Independent Sage update (see below). It seems COVID is expected to settle to a background level of cases, but currently we do not know whether that will be thousands or tens of thousands of cases per day; nor do we know to what extent the virus will eventually make people sick. That will in part depend on the percentage of the population that is fully vaccinated plus immunity developed in children and others through repeated infection. Immunity will build up over time, whilst new strains will evolve as with flu, possibly resulting in the need for an annual booster for the most vulnerable. We may have to wait several months for the 'floor' of the epidemic to become apparent.
The hope is that it will be possible for life to return to normal in February 2022, except perhaps for the continued wearing of face masks in some indoor settings.
This week
Last Sunday Nadhim Zahawi said he would support the isolation period being reduced from 7 days to 5 days to enable people to get back to work more quickly, as in the USA.
On Thursday it was announced that from 17th January, people with COVID-19 in England can end their self-isolation after 5 full days, as long as they test negative on days 5 and 6.
If the day someone tests positive is counted as day zero, the reality is anyone testing COVID positive could be off work or school for nearer 7 days, and if they are feeling poorly it might be longer.
What might happen next
See our longer term forecast for general direction of travel to the end of January.
COVID video updates
The usual charts can be found in the Zoe COVID Study and Independent SAGE weekly updates.
Click to watch Zoe COVID Symptom Study update on 13th January 2022 presented by Tim Spector
Click to watch Independent SAGE update on 14th January 2022
Both videos are worth viewing by 'chart-watchers' who have the time.
U3A
Nothing to report
Overseas travel
Situation remains fluid, refer to current government advice, and prepare contingency plans in case circumstances change in the country you are visiting.
Overseas travellers will most likely need to be fully vaccinated.
List of vaccines
Here is the updated list of COVID-19 vaccines ordered by the UK. It looks as though for now the government has settled on Pfizer as first choice with Moderna second and Astrazeneca held in reserve.
Valneva has been cancelled, and approval has not yet been sought for using Novavax in the EU and US although approval has been sought for use in third world countries.
For two doses plus boosters, only about 200M doses will be needed in 2021 and Jan/Feb 2022 for the population of the UK. The government has now signed deals to buy 114 million additional doses of the Pfizer (54M) and Moderna (60M) vaccines to use in 2022 and 2023.
The press announcement goes on to say that 60M doses of Novavax vaccine are expected to be delivered in 2022 and 7.5M doses of GSK/Sanofi, so there seems no intention to cancel these late arrivals.
Click for Guardian report - Novavax expected to be become fourth Covid vaccine available in UK
| COVID-19 vaccine | Doses ordered (million) | Status |
| Pfizer BioNTech, two dose, -70 deg C | 40+60+35 | Approved, deliveries continuing, made in Belgium (EU). An additional 60M doses have been ordered for booster shots for the most vulnerable in the autumn. A further 35M doses were ordered in August 2021 for delivery in 2022. |
| Astrazeneca, two dose, fridge | 100 | Approved for those aged 30+ years; deliveries continuing. Batches made in UK, Belgium and India. |
| Moderna, two dose, -20 deg C | 7+10 | Approved. First deliveries to Wales and Scotland 7th April 2021 then England 13th April; mainly for those aged under 50 years awaiting vaccination. |
| Valneva, two dose | 60+40 order cancelled |
A jab from French company Valneva will be made in Livingston, West Lothian, Scotland. Order cancelled September 2021. Delivery had been expected to start in second half of 2021. |
| Janssen, single dose | 20 | Approved, a jab from Belgian firm Janssen, owned by Johnson and Johnson; UK approval 28th May. Order reduced from 30 to 20M. |
| Novavax | 60 | A jab manufactured by US firm Novavax being made in Stockton-on-Tees UK; phase III trials complete, but approval has not yet been sought in EU and US. Glaxo Smith Kline (GSK) contracted to fill and package vials. Delivery expected in 2022. |
| GSK Sanofi | 60 | Some delay due to adjusting the formula to give better protection to the elderly; expected approval and delivery of 7.5M doses in 2022. |
| Curevac | 50 ? | Contract placed with German company Feb 2021. Possible source of new variant vaccine; disappointing trial results have resulted in the company working on a second generation vaccine. Future uncertain. |
Table of vaccines ordered by the UK government
 Present rate of new cases
The average rate of infection per 100,000 population per week copied from the Coronavirus Dashboard is shown in the following table.
| Region | Case rate (last week) |
Case rate (this week) |
| England | 1,924 | 1,478 |
| Wales | 2,380 | 1,189 |
| Scotland | 2,026 | 1,259 |
| Northern Ireland | 2,905 | 1,755 |
| London (region) | 1,801 | 1,334 |
| Worcestershire | 1,629 | 1,351 |
| Malvern Hills | 1,129 | 1,007 |
Seven day Case Rate per 100,000 reported 10th January 2022
The main point to note is that cases have begun falling across all nations of the UK.
As a yardstick we suggest a figure of below 10 can be considered LOW, so there is a long way still to go.
How to request a COVID test
In order to protect others it is important to get a test and self isolate if you feel unwell with either classic COVID symptoms, or cold and flu like symptoms which can be caused by the Delta variant.
There are now two types of test you can get. The more accurate PCR test involving a throat and nose swab which is sent to a laboratory for analysis and the Lateral Flow Device test.
Click for government guidance on types of tests
Getting a PCR test
Click the link below for information on how to get a free NHS PCR test if you think you may have Coronavirus:
https://www.gov.uk/get-coronavirus-test
We feel the website discourages people from seeking a PCR test who don't have all the classic symptoms. If you feel strongly enough, press on answering the questions so as to get your PCR test.
In case of difficulty you can try phoning the Coronavirus contact centre by dialing 119.
Alternatively settle for a 'Nasal swab' Lateral Flow Device test in the comfort of your own home (see below).
According to Google there is a 'drive through' COVID testing station at County Hall near the Countrywide Centre, and a 'walk through' at Pershore.
There is also a COVID testing station at the Worcester Royal Hospital for screening patients before admission.
If you cannot get to these you can order a home PCR test kit.
If you test COVID positive you should self-isolate for 10 days.
Getting a Lateral Flow Device test
Lateral Flow Device tests (LFD) can either be booked at Claremont Pharmacy in Barnards Green, Evans Pharmacy in Malvern Link, or taken at home.
The test is intended to screen those who do not show the classic symptoms of COVID-19 and provides a means to check you are 'virus free' at home - either before visiting an elderly person, going to work, or attending a crowded event. It also provides a means to check whether or not you have Coronavirus if you are feeling poorly with cold and flu like symptoms.
 You
can collect home test kits,
for example packaged as the COVID-19 Self-Test (Rapid Antigen Test) in boxes
of 7 tests, from Malvern library, the Co-op, and most pharmacies such as Boots and Murrays in Church
Street, Claremont House and Lloyds in Barnards Green, Murrays at Prospect
View, Evans and Murrays in Malvern Link, and Boots and Morrisons on the
Enigma Retail Park.
You
can collect home test kits,
for example packaged as the COVID-19 Self-Test (Rapid Antigen Test) in boxes
of 7 tests, from Malvern library, the Co-op, and most pharmacies such as Boots and Murrays in Church
Street, Claremont House and Lloyds in Barnards Green, Murrays at Prospect
View, Evans and Murrays in Malvern Link, and Boots and Morrisons on the
Enigma Retail Park.
If collecting from a pharmacy you now have to go on-line and get a collection code to present to the pharmacy in order to obtain a pack of 7 tests. This involves giving NHS Test and Trace your email and/or mobile phone number and address.
http://www.gov.uk/get-collect-code
The LFD now comes in two versions.
-
The Throat and Nose Swab kit;
-
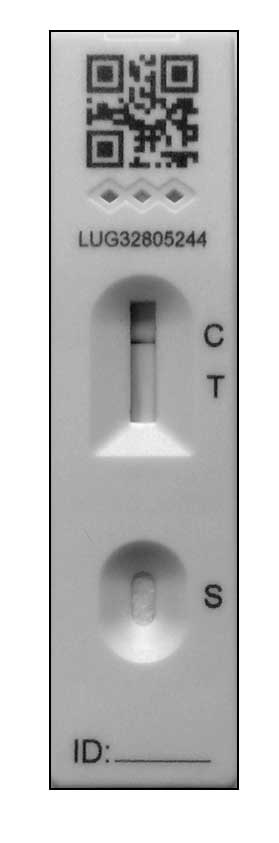
The Nose Swab only kit (Orient Gene, Acon Flowflex and MP Biomedicals).
(Lateral Flow Device cassette shown on the right).
ACON Flowflex comes in a blue and white pack.
Orient Gene comes in a green and white pack.
MP Biomedicals come in a blue, white and grey pack.
Click for instructions for using the LFD test kits
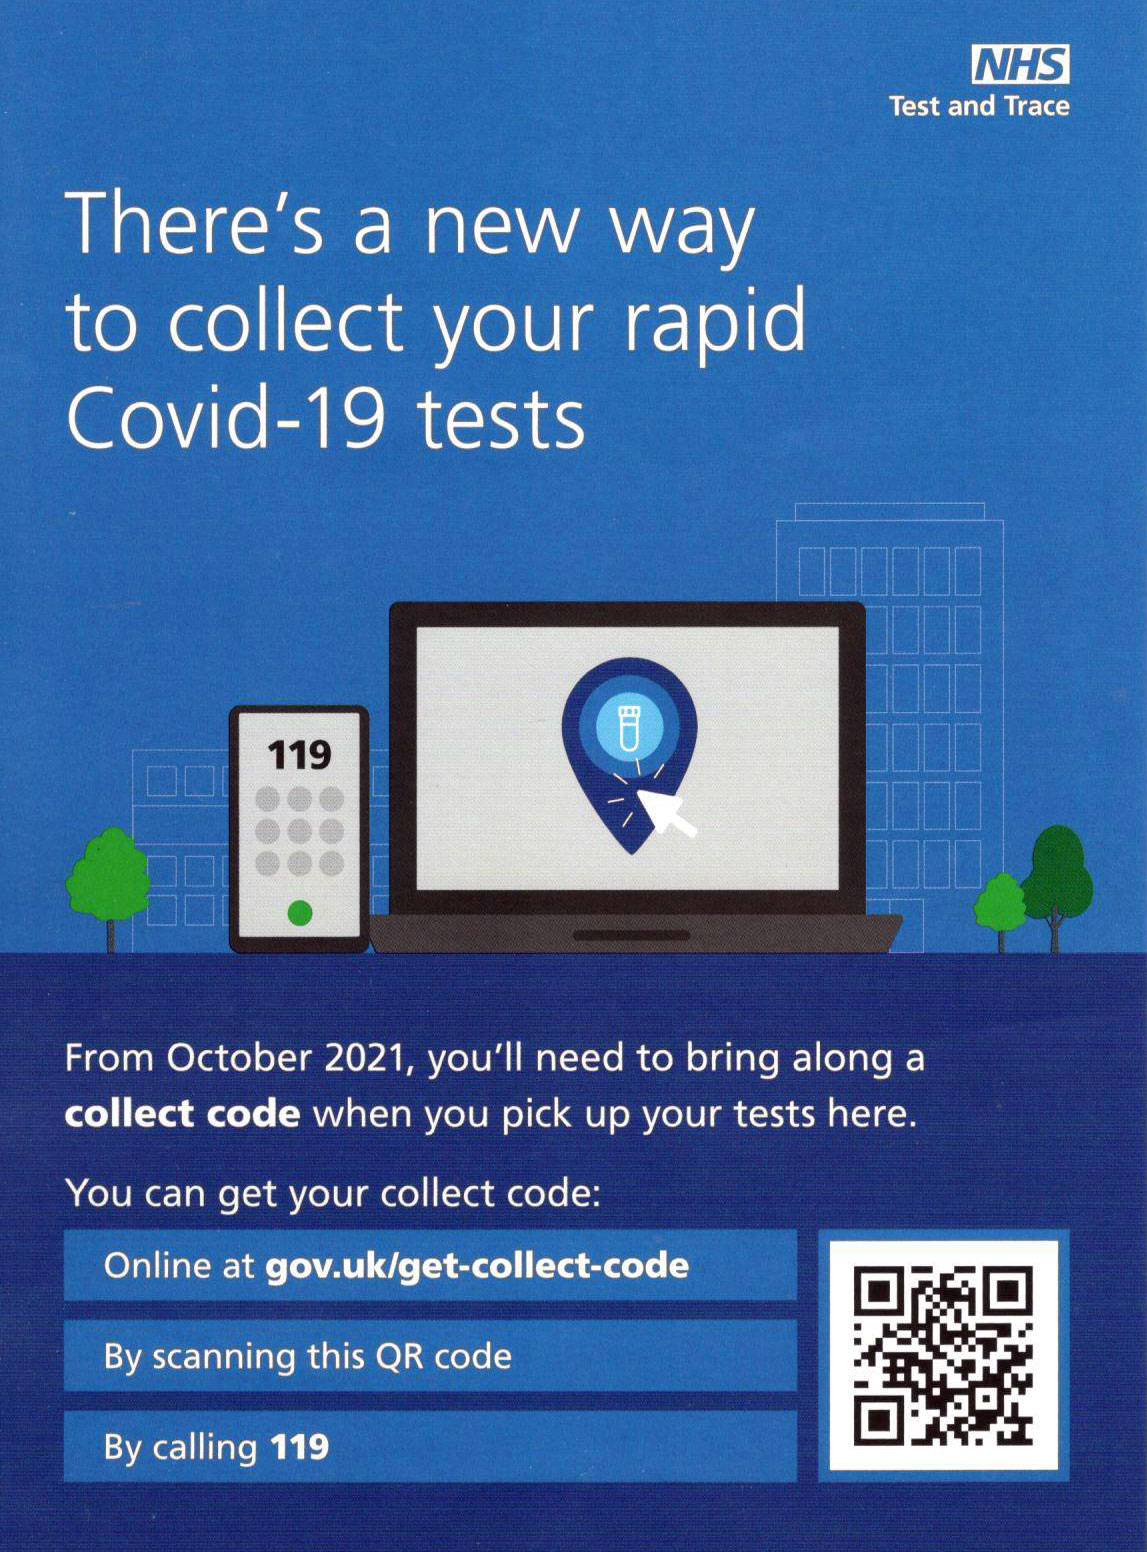
Leaflet at Boots the Chemist
The new Nasal swab test kit which only requires a nose swab is the easiest to use and the best one to get but it is not yet widely available. On 10th November we found Boots in Church Street and Malvern Library were still supplying the old Throat and Nose kit; Murrays in Church Street had the new kits and Malvern library thought the library in St John's Worcester might have the new kits.
Click for NHS information on Rapid Lateral Flow Test sites and collection sites in Malvern
Hint: to see the list, click on 'filter' and then 'pick up sites for test kits' checkbox.
Click for WCC info about Lateral Flow Tests
In our opinion, many Seniors will find the classic Throat and Nose Swab home test kit difficult to use as you need to rub the tonsils or thereabouts with the swab-stick without touching the tongue, teeth, cheeks, gums or any other surface before swabbing the nose. Doing this standing in front of a mirror on your own without gagging while holding a torch in the other hand, won't be easy unless you have a steady hand and good eyesight.
The Nose Swab kit is by far the best one for testing yourself at home.
If you test COVID positive you should isolate and take a more accurate PCR test to confirm the result.
NHS Test and Trace want people to report the result of their home LFD tests within 24 hours at:
www.gov.uk/report-covid19-result
This helps NHS Test and Trace monitor where the issue of the free LFD tests is proving most effective and the spread of the disease.
However, it's tedious to enter your Lateral Flow Test result on the government website and we imagine many people now don't bother.
Nose swab home test kit obtained from Murrays
About the COVID Symptom Study app (Zoe)
![]() You
can help others by downloading the COVID Symptom Study app onto your
smart-phone or Ipad and reporting how you feel either daily, or as you are
able. Note there is no desktop PC version for Windows.
You
can help others by downloading the COVID Symptom Study app onto your
smart-phone or Ipad and reporting how you feel either daily, or as you are
able. Note there is no desktop PC version for Windows.
For further details click this link: https://covid19.joinzoe.com
The Zoe app, which is easy to use, allows you to report whether or not you are feeling well and if you have had a test for COVID. This helps Kings College London monitor the spread and symptoms of the disease and give advice to government. This is an important source of data as we progress through the EXIT wave.
There are questions allowing you to enter your vaccine type and whether any side effects; this now includes boosters and flu jabs.
About the NHS COVID-19 contact tracing app (England)
Release of the NHS COVID-19 contact tracing app for Apple and Android smartphones was announced on 24th September 2020.
Click this link for NHS Coronavirus app information
If you have been close to someone who has tested COVID positive, your smart-phone will be pinged and you may be advised to self-isolate
The period for self isolating keeps changing.
You can now take an LFD test from 6 days after the day your symptoms started, or the day your test was taken if you did not have symptoms, and another LFD test at least 24 hours later.
If both these test results are negative, and you do not have a high temperature, you may end your self-isolation.
Otherwise the isolation period is 10 days.
Bear in mind some individuals may take much longer to fully recover.
Note: be aware triple vaccinated individuals can still catch the Delta variant of the Omicron variant and pass it on to others.
About the NHS app and Covid Pass
An NHS COVID Pass shows your coronavirus (COVID-19) vaccination details and/or test results. This is your COVID-19 status. You may be asked to show your pass to travel abroad, or at events and venues in England asking for proof of your COVID-19 status.
For large UK events you may get in either by the fact:
-
you are fully-vaccinated;
-
you have had COVID as recorded by a positive PCR test;
-
you have taken and reported a recent Lateral Flow test.
You will need the NHS app installed on your smartphone and be registered with the NHS in order to display your vaccination status.
Note: this is not the NHS COVID-19 app
If you don't have a smartphone you should be able to login from a PC to obtain a printed copy.
Click to login from a desktop computer or laptop
You can use your NHS login when signing in to report the result of Lateral Flow Device tests taken at home, which must be done within 24 hours.
Summary of Links
Symptoms
Article about the effects of Coronavirus on the human body
Reporting and how to obtain a test
How to get a test
https://www.nhs.uk/coronavirus
About joining the Zoe COVID Symptom Study:
Guidance
UK government Coronavirus guidance
COVID-19 Response: Autumn and Winter Plan 2021 for England
UK Health and Security Agency (UKHSA) website
COVID Alert states
Guidance on UK COVID-19 alert level methodology: an overview
COVID-19 Alert Level lowered to 3 on 10th May 2021
Tiers
Guidance on tiers: what you need to know
Government postcode checker to find tier for other areas
Statistics
UK government COVID-19: Omicron daily overview
UK government Coronavirus Dashboard
Coronavirus Dashboard Interactive Map
ONS data on deaths in England and Wales (Excel spreadsheet)
NHS England COVID-19 Daily Deaths
NHS England COVID-19 Hospital Admissions
NHS England vaccination statistics
Worcestershire Coronavirus Dashboard
Worcestershire COVID-19 Vaccinations Dashboard
HSA COVID-19 vaccine weekly surveillance reports
Information about NHS hospital bed numbers: past, present, future
A glimpse of the worldwide vaccination situation can be found on the Our World in Data website.
Click for chart showing % vaccinated
Modelling
A forecast of the progression of the COVID-19 epidemic can be found on a University College London (UCL) website.
Click for UCL Long-term forecasting of the COVID-19 epidemic
A projection of the future COVID-19 death toll and daily deaths can be found on The Institute for Health Metrics and Evaluation website.
Click for IHME projection of COVID-19 deaths
Reports
ONS Coronavirus (COVID-19) Roundup
The bigger picture
Worldometer summary of coronavirus cases worldwide
European Centre for Disease Prevention and Control info
https://www.ecdc.europa.eu/en/geographical-distribution-2019-ncov-cases
World Health Organisation info
Window on the USA
Centre for Disease Control (CDC)
American Association of Retired People (AARP)
Worcestershire
Help:
http://www.worcestershire.gov.uk/here2help
Worcestershire County Council COVID-19 information:
http://www.worcestershire.gov.uk/coronavirus
Here you will find a useful link,
'Website: Number of new cases by date in Worcestershire'
which displays interesting COVID charts and statistics for Worcestershire
Miscellaneous
Spanish Flu
Dr Jeff Kildea's commentary about the 1919 outbreak of Spanish Flu in Australia
Views of Martin McKee, Professor of European Public Health
Follow Martin McKee on Twitter
SAGE membership
Scientific Advisory Group for Emergencies (SAGE)
Scottish government:
Link to Scottish Government website
Link to Postcode checker for COVID restrictions by protection level in areas of Scotland
Welsh Government:
Guidance on COVID alert levels in Wales
![]()
The interpretations and opinions expressed are our own
Last updated 17th January 2022