Angus and Rosemary's Miscellany
of Malvern - Other Resources
|
Coronavirus (COVID-19) epidemic weekly update for Malvern SeniorsClick to read our observations on politics and world events 6th March 2022 BACK TO NORMAL PreambleOver the last two years we have been keeping an eye on the published government figures and monitoring the media to asses the likely level of risk for Seniors in the Malvern Hills district and providing links to where further information could be found. Now the worst of the epidemic is over the numbers are of far less importance, but we'll carry on with our blog for a while. Testing is being run down and the public is increasingly not recording the result of Lateral Flow tests so the daily cases reported on the Coronavirus Dashboard grossly underestimate the true situation. Roughly half the deaths reported by PHE are thought be elderly patients who die with COVID but not from it. The best sources of data are now:
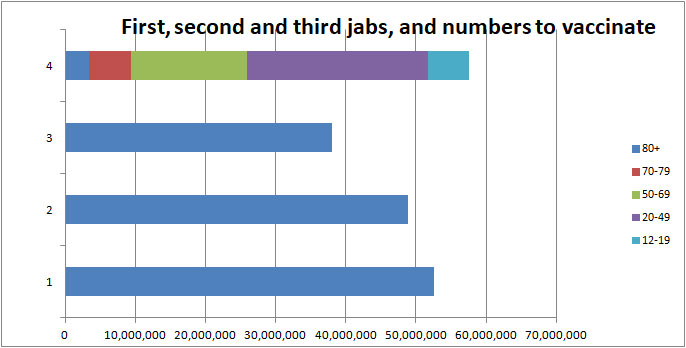
This page will usually be updated each weekend using Friday's data. ContentsFurther information: About the Zoe COVID symptom study About the NHS contact tracing app SummaryThere is little change to last week's data. For the majority in England who have been fully vaccinated life will be returning to normal. The situation could be more complex for the clinically vulnerable who might want to discuss their condition and precautions with either their GP or Specialist. For example it might be desirable to take a Lateral Flow test if feeling unwell and seek antiviral drugs at the earliest opportunity if tested COVID positive. While the Omicron virus remains prevalent there is still a good chance we will all catch COVID-19 at some time or other. It may make us feel very poorly and send us to bed for a few days; and it could take ten days or so for us to recover but, except for the very frail, we are unlikely to be hospitalised and our resistance to future infection should be bolstered. COVID hospital Intensive Care Unit (ICU) beds are now said to be mostly occupied by those who are not fully vaccinated so make sure to get your booster jab if you have not already done so. Lateral Flow Device kits which only require a nose swab can be used to test for COVID at home. However be aware they are not 100% reliable and you could be infecting others before there is enough virus for the test to show positive. If you are feeling poorly and test negative consider testing again a day or two later if symptoms persist. Note: the government is discontinuing the supply of free Lateral Flow Tests on 1st April so you may want to stock up if you are a contributor to the Zoe COVID Symptom Study. A local summary of COVID data can be found on the Worcestershire Coronavirus Dashboard. Deaths are on page 7, and hospital beds on page 9. Note: use the arrow <> buttons at the bottom of the Dashboard screen to move between pages. Click for Worcestershire County Council COVID-19 news Click for Simple Summary of Malvern numbers on the Coronavirus dashboard Click for the latest UK Government Coronavirus advice How to get vaccinatedBy now we expect most Seniors are fully vaccinated. Those aged 5 - 11 years can in principle be offered the vaccine but it sounds like the rollout could be delayed. All those aged 16+ years can book a booster 3 months after their second dose. Click NHS link - Who can get a coronavirus (COVID-19) vaccine For information about walk-in centres in Worcestershire go to the website: and click the Vaccine Rollout tab at the top of the page. Click for information about vaccination at the Three Counties Showground Otherwise either see the NHS website for walk-in opening times and vaccine availability: Or click this link for more information and to book a vaccination on-line: Book a Coronavirus vaccination - NHS (www.nhs.uk) Or talk to your GP. Note: the immuno-compromised may be offered a third jab as part of their primary course, followed by a booster 3 months later. More about vaccinationsThe Omicron variant of COVID-19 is highly infectious and still widespread in the community so all of us are likely to catch it at some time or other - it can make you 'very poorly' so it is essential to get your booster jab if you have not already had it. VaccinometerOur bar chart below shows the total number of:
Vaccinometer as of 20th February 2022 People are still coming forward to be vaccinated, but the rate is so slow you will see little change to this chart during 2022. Vaccination statistics can be found on the Vaccination tab of the Coronavirus Dashboard. Booster jabsThe government says everyone aged 18+ years has been offered a booster jab. To date about 49M have had two doses, and 38M booster doses have been administered, suggesting 11M still to boost in the UK; but those under 16 years are not yet eligible so there are probably 6M people still to get their booster. Protection against hospitalisationThe UKHSAA COVID-19 vaccine surveillance reports indicate the likely effectiveness of the vaccines. To quote:
Click for UKHSA COVID-19 vaccine surveillance report Week 9, 3rd March 2022
Effectiveness against mortalityThe protection offered by the vaccines against death is less clear to us, but our reading of the report is that if you are taken into hospital and have had only 2 jabs there is a 50% chance you might die. However after a Booster the risk is reduced to 1 in 8.
Vaccinations WorldwideA chart of the worldwide vaccination situation can be found on the Our World in Data website. Click for worldwide statistics Hint: click the country list on the left hand side of the screen to add or remove countries from the chart.
|
| Date | Prevalence (England) | Ratio of people with COVID |
| 19th February 2022 | 2,096,200 | 1:25 |
| 26th February 2022 | 1,933,500 | 1:30 |
Prevalence of COVID-19 in England estimated by ONS
Zoe COVID Symptom study
The ZOE COVID Symptom Study predicts 2,180,517 people have symptomatic COVID in the UK and estimates 149,000 new cases per day compared to 152,000 last week. The fall in cases appears to be approaching a plateau.
| Prevalence | Estimated new cases per day | |
| Last week | 2,436,988 | 152,000 |
| This week | 2,180,517 | 149,000 |
Prevalence of COVID-19 in UK estimated by Zoe COVID Symptom Study
Numbers testing COVID positive in Worcestershire (PHE)
The breakdown of those testing COVID positive by Worcestershire Lower Tier Local Authorities (LTLA) is shown in the following table, together with comparisons for Herefordshire, a more sparsely populated county, and the city of Leicester.
Note: the cumulative cases are copied from the 'Cases by area' (whole pandemic) data set of the Coronavirus Dashboard. The weekly increase is the difference between this week and last week's total.
| Districts of Worcs | Number testing positive | Weekly increase | Population |
| Bromsgrove | 29,214 | +301 | 98,529 |
| Malvern Hills | 16,147 | +342 | 77,545 |
| Redditch | 25,589 | +274 | 85,317 |
| Worcester | 28,745 | +480 | 103,542 |
| Wychavon | 31,758 | +595 | 126,240 |
| Wyre Forest | 26,623 | +251 | 100,957 |
| TOTAL | 158,076 | +2,243 | 592,130 |
| COMPARE WITH | |||
| County of Hereford | 43,220 | +629 | 195,000 |
| Leicester (city of) | 111,956 | +680 | 400,000 |
Cumulative cases reported by PHE in Worcestershire to 4th March 2022
Note: the weekly increase is indicative; the seven day average by area, which varies day to day, is an alternative metric that can be found on the Coronavirus dashboard.
The main point to note is that cases are broadly the same as last week; actual infections could be four times the number testing COVID positive.
The infection rate per head in the Malvern Hills is now double that in the city of Leicester; this may be because people in Leicester have built up more immunity from previous infections and we are playing catch up.
Cases in Malvern Hills by age group
Cases in the under 60s have been falling steeply and are now about the same as those in the 60+ group.
Click for cases by specimen date age demographics in the Malvern Hills
Interactive maps
At the bottom of the Coronavirus Dashboard (daily update) page there is an Interactive Map which is coloured to show infection rates across the country. Cases are falling in England but rising in Scotland where there are more controls.
Click for Interactive Map of COVID cases
Note: the Interactive Map works on desktop PCs but it's possible you may encounter difficulties using a tablet or smartphone.
Recent weekly COVID positive tests to 20th February are: North Malvern 39; Malvern Link 18; Pickersleigh 32; Barnards Green 33; Malvern Wells and Priory 32; Callow End and Hanley 30; Upton and Welland 45.
Another map can be found on the Zoe COVID Study website indicating extrapolated cases based on reports from those using the Zoe app.
Click for People with COVID (estimated from the Zoe app)
Number of deaths
Statistics on COVID deaths are published by Public Health England, The Office of National Statistics, and NHS England. These can't be directly compared as they cover different periods, but together the figures paint a picture of the direction of travel.
The UK daily death rate has been going down but it's possible it will plateau at about 90 deaths per day if daily cases begin to flat-line.
 PHE figures
Public Health England reports there were 701 COVID (28) deaths in UK hospitals and care homes in the last week bringing the cumulative total to 162,008 (including deaths linked to repeat infections), with the daily average falling from 121 to 101 deaths per day.
In comparison averaged over recent years 1,700 people die daily from all causes.
Click to view the UK government Coronavirus Dashboard
Note: in roughly half the cases recently reported by PHE it is thought COVID-19 might not be the underlying cause of death.
ONS figures
The Office of National Statistics (ONS) reports registered deaths in England and Wales where COVID-19 is mentioned somewhere on the death certificate. The ONS figures lag the PHE figures by 10 - 14 days and do not include Northern Ireland and Scotland.
Click for national ONS data on deaths (Excel spreadsheet)
The ONS figures are broken down by District providing a glimpse of where deaths are occurring. The provisional cumulative total of COVID related deaths in Worcestershire reported by the ONS up to 18th February (week 7 of 2022) is shown below.
Note: the numbers are from the ONS Death Registrations-Pivot table
| Districts of Worcs |
Deaths 2020 |
Deaths 2021 |
Deaths 2022 |
Week 7 | Population |
| Bromsgrove | 164 | 142 | 14 | 2 | 98,529 |
| Malvern Hills | 61 | 98 | 7 | 0 | 77,545 |
| Redditch | 108 | 109 | 11 | 2 | 85,317 |
| Worcester | 87 | 134 | 11 | 1 | 103,542 |
| Wychavon | 157 | 154 | 13 | 3 | 126,240 |
| Wyre Forest | 171 | 132 | 14 | 3 | 100,957 |
| TOTAL | 748 | 769 | 70 | 11 | 592,130 |
Provisional cumulative COVID-19 deaths in Worcestershire registered by ONS to 18th February 2022
Note: summation of rows 9 to 339 of the ONS deaths Registrations-Pivot table.
There was 1 death in a care home and 1 in hospital in Bromsgrove; 2 deaths in hospital in Redditch; 1 death in hospital in the city of Worcester; 1 death in a care home and 2 in hospital in Wychavon; and 2 deaths at home and 1 in hospital in Wyre Forest.
In England and Wales 861 COVID-19 related deaths were reported in the week to 18th February, 204 less than the week before, a fall of 9%. Of these 176 were in a care home, 84 at home, 24 in a hospice, 570 in hospital and 7 elsewhere.
Click for ONS Coronavirus (COVID-19) latest insights: Deaths
NHS England figures for Worcestershire
The table below shows latest COVID deaths in Worcestershire hospitals reported by NHS England on 4th March 2022.
| Worcestershire | Cumulative deaths | Past week |
| Acute hospitals | 966 | 9 |
| Care hospitals | 68 | 0 |
| TOTAL | 1,034 | 9 |
Click for NHS COVID-19 total announced deaths
Note: look for COVID Total announced deaths sheet, then select tab Deaths by Trust
Risk of COVID-19 death by age band (Delta and Omicron)
NHS England provides an analysis of COVID-19 deaths in hospital in England and Wales by age band. Shown below is a snapshot of 3,971 recent deaths for the period 7th January 2022 to 3rd February 2022.
During this period deaths from Delta probably fell while those from Omicron increased. We do not know the exact mix, but there is an indication the risk of death is moving towards those aged 80+ years, who will generally be more frail and have co-morbidities.
| Age band | Number of COVID deaths | % of deaths |
| 0 - 19 | 11 | 0.3 |
| 20 - 39 | 43 | 1 |
| 40 - 59 | 287 | 7 |
| 60 - 79 | 1,404 | 35 |
| 80+ | 2,226 | 56 |
Relative risk of COVID-19 death by age band
The latest figures show the risk of death has fallen slightly in those aged 40 to 79 years, rising in those aged 80+.
Those aged 60+ still account for more than 90% of deaths, but remember that due to vaccination the death rate as a proportion of new infections is ten times lower than in 2020.
Healthcare numbers
The UK government Coronavirus Dashboard includes important information about healthcare statistics and NHS bed occupancy.
| Hospital COVID cases (UK) | Number | Change since last week |
| Patients currently in hospital | 10,510 | -257 |
| Patients on ventilation | 264 | -25 |
| Patients admitted daily | 1,137 | -32 |
Headline summary of patients in hospital reported on 4th March 2022
The trend in UK COVID-19 bed occupancy continues slowly downwards.
Bed numbers by region in England
Tabulated figures for COVID bed occupancy in England can be found on the NHS England website and these give a good indication of direction of travel:
Click for NHS England COVID-19 Hospital bed Activity statistics
Note: see the latest Daily Admissions and Beds spreadsheets, then look for all COVID beds.
| Region | 25th February 2022 | 4th March 2022 | 15th January 2021 |
| England | 8,498 | 8,403 | 33,362 |
| London | 1,661 | 1,529 | 7,811 |
| Midlands | 1,568 | 1,506 | 5,890 |
Comparison of All beds COVID data for London and Midlands
In the last week the number of COVID-19 General and Acute beds roughly flat-lined.
For comparison, the number of beds occupied during the peak of the epidemic in January 2021 is shown in red in the right hand column of the table.
 Worcestershire hospital beds
There were 91 patients in hospital with Coronavirus on 4th March 2022 of which 1 was a ventilated bed. Roughly 34% of the peak experienced last January.
Click for Summary of Malvern numbers on the Coronavirus dashboard
This page also reports deaths in the last week.
Deaths in Malvern Hills
Between 26 February 2022 and 4 March 2022, there was 1 death within 28 days of a positive coronavirus test.
Forecast for the week ahead
The number of UK COVID (28) deaths (as recorded by PHE) may increase by up to 700 towards 162,700 during the 7 days ending 11th March 2022, with the average daily death rate hovering around 100.
In the county of Worcestershire, assuming a 0.1% death rate, the 2,243 new cases this week should translate to no more than 3 deaths per week in the second half of March.
The weekly average of UK daily hospital admissions might fall a tad towards 1,075 patients per day.
Longer term outlook
It's difficult to forecast exactly what happens next. We imagine that we have entered the endemic stage of the disease with a continuing background level of infection, dipping in the summer and rising in the winter, modulated by new variants to which we may or may not have less protection. We anticipate more deaths than from Flu in the elderly population and cases of Long COVID causing fatigue in some individuals for many months. Otherwise, we expect the majority of the UK population under 60 years to be little affected by COVID-19.
In England it is now a personal decision whether or not to take precautions depending on our own situation and assessment of risk. Some may think it best to ignore protective measures in order quickly to build up herd immunity through natural infection, while the clinically vulnerable might be more cautious.
See also summary of links section for UCL and IHME modelling projections.
The latest UCL projection is that the daily death rate could fall to 80 in the summer, possibly rising to 220 next winter.
Advice for Seniors
We judge the risk of exposure to the Omicron variant still to be HIGH; see our riskometer opposite.
How this affects you will depend on your vaccination status. UKHSA figures suggest the chance of being hospitalised some months after a Booster could be around 25% compared to the unvaccinated.
Two doses give very little protection.
6M people remain unvaccinated in the UK and as many again have not had their booster; for many time is running out and perhaps up to 6,000 will die unnecessarily in coming weeks.
Recently there have been no more than 11 COVID related deaths per week in Worcestershire which has a population of 600,000 so we currently judge the risk of death for triple vaccinated Seniors to be LOW while the risk of Long COVID might be MODERATE .
It is likely that, despite being triple vaccinated, all Seniors will at some time or other become ill with the Omicron variant of COVID-19.
Some may reasonably think there is little point in taking precautions, such as the wearing of facemasks, being happy to accept the risk of infection before the protection of the vaccines wanes. However for those hoping to avoid infection the simple safeguards to remember are to:
-
book your booster dose as soon as you are contacted by either your GP or the NHS; between five days and two weeks after the booster most people should be well protected from severe illness;
-
don't forget your flu jab;
-
look out for a second booster programme for those aged 75+ years in the spring;
-
wash your HANDS thoroughly, using soap and hot water, for 20 seconds, including after handling deliveries to your home, to kill virus picked up from contaminated surfaces (see note 1);
-
ideally wear either a well fitting FACE covering, or FFP2 face mask when unavoidably near other people for example when in shops, health-care settings, and when using public transport;
-
SPACE at least 2 metres from people you don't feel safe with (see note 2);
-
preferably socialise with friends and other households outdoors in the FRESH AIR else, if you are indoors, either ventilate by keeping windows open as far as is practicable or put a HEPA air purifier in the room;
-
consider avoiding crowded indoor settings and minimise TIME near strangers;
-
self-isolate for 10 days if you unwell with cold or flu like symptoms and test COVID positive; according to the Zoe COVID Study the current top five symptoms in order of prevalence are runny nose, headache, sore throat, fatigue, and sneezing which are often hard to distinguish from a common cold - you might alternatively suffer from fever with a temperature of up to 103 deg F, and a slight reduction in sense of taste;
-
respect others and give them space.
Notes:
1) Wash your hands thoroughly before touching your face to avoid transferring virus from contaminated surfaces to your mouth, eyes and nose. If outdoors use an alcohol based hand gel.
2) Two metres is further than you think - roughly an arm and a walking stick away.
3) The COVID Symptom Study people suggest that if you have symptoms of a common cold there is a fair chance you might have COVID.
Annex
Commentary
This week
The media has been preoccupied with Russia's invasion of Ukraine and Vladimir Putin's war crimes, so nothing new to relate about COVID.
COVID video updates
The usual charts can be found in the Zoe COVID Study and Independent SAGE weekly updates.
Click to watch Zoe COVID Symptom Study update on 3rd March 2022 presented by Tim Spector.
Click to watch Independent SAGE update on 4th March 2022
U3A
Some groups have started meeting again in person. Attendance is gradually rising.
Overseas travel
Refer to current government advice, and prepare contingency plans in case circumstances change in the country you are visiting.
Australia is opening up.
List of vaccines
Here is the updated list of COVID-19 vaccines ordered by the UK. It looks as though for now the government has settled on Pfizer as first choice with Moderna second and Astrazeneca held in reserve.
Valneva has been cancelled, and approval has not yet been sought for using Novavax in the EU and US although approval has been sought for use in third world countries.
For two doses plus boosters, only about 200M doses will be needed in 2021 and Jan/Feb 2022 for the population of the UK. The government has now signed deals to buy 114 million additional doses of the Pfizer (54M) and Moderna (60M) vaccines to use in 2022 and 2023.
The press announcement goes on to say that 60M doses of Novavax vaccine are expected to be delivered in 2022 and 7.5M doses of GSK/Sanofi, so there seems no intention to cancel these late arrivals.
Click for Guardian report - Novavax expected to be become fourth Covid vaccine available in UK
| COVID-19 vaccine | Doses ordered (million) | Status |
| Pfizer BioNTech, two dose, -70 deg C | 40+60+35 | Approved, deliveries continuing, made in Belgium (EU). An additional 60M doses have been ordered for booster shots for the most vulnerable in the autumn. A further 35M doses were ordered in August 2021 for delivery in 2022. |
| Astrazeneca, two dose, fridge | 100 | Approved for those aged 30+ years; deliveries continuing. Batches made in UK, Belgium and India. |
| Moderna, two dose, -20 deg C | 7+10 | Approved. First deliveries to Wales and Scotland 7th April 2021 then England 13th April; mainly for those aged under 50 years awaiting vaccination. |
| Valneva, two dose | 60+40 order cancelled |
A jab from French company Valneva will be made in Livingston, West Lothian, Scotland. Order cancelled September 2021. Delivery had been expected to start in second half of 2021. |
| Janssen, single dose | 20 | Approved, a jab from Belgian firm Janssen, owned by Johnson and Johnson; UK approval 28th May. Order reduced from 30 to 20M. |
| Nuvaxovid | 60 | A jab manufactured by US firm Novavax being made in Stockton-on-Tees UK. Glaxo Smith Kline (GSK) contracted to fill and package vials. Approved by MHRA 3rd Feb 2022. JCVI to advise how vaccine will be used. |
| GSK Sanofi | 60 | Some delay due to adjusting the formula to give better protection to the elderly; expected approval and delivery of 7.5M doses in 2022. |
| Curevac | 50 ? | Contract placed with German company Feb 2021. Possible source of new variant vaccine; disappointing trial results have resulted in the company working on a second generation vaccine. Future uncertain. |
Table of vaccines ordered by the UK government
Present rate of
detected new cases
The average rate of COVID positive tests per 100,000 population per week copied from the Coronavirus Dashboard is shown in the following table.
| Region | Case rate (last week) |
Case rate (this week) |
| England | 415 | 296 |
| Wales | 209 | 163 |
| Scotland | 790 | 830 |
| Northern Ireland | 928 | 801 |
| London (region) | 394 | 293 |
| Worcestershire | 497 | 347 |
| Malvern Hills | 527 | 426 |
Seven day Case Rate per 100,000 reported 4th March 2022
Apart from Scotland, cases are down a little.
Note: actual infections could be 4 times the number of positive tests.
As a yardstick we suggest a figure of below 10 can be considered LOW, so there is still a long way to go.
How to request a COVID test
Note: much of this section is largely historical. Now the population is vaccinated the government no longer sees testing as important. The availability of PCR tests is being cut back to save money and Lateral Flow tests will no longer be free after 1st April 2022.
In order to protect others it is important to get a test and self isolate if you feel unwell with either classic COVID symptoms, or cold and flu like symptoms which can be caused by the Omicron variant.;
There are now two types of test you can get. The more accurate PCR test involving a throat and nose swab which is sent to a laboratory for analysis and the Lateral Flow Device test.
Click for government guidance on types of tests
Getting a PCR test
Click the link below for information on how to get a free NHS PCR test if you think you may have Coronavirus:
https://www.gov.uk/get-coronavirus-test
We feel the website discourages people from seeking a PCR test who don't have all the classic symptoms. If you feel strongly enough, press on answering the questions so as to get your PCR test.
In case of difficulty you can try phoning the Coronavirus contact centre by dialing 119.
Alternatively settle for a 'Nasal swab' Lateral Flow Device test in the comfort of your own home (see below).
According to Google there is a 'drive through' COVID testing station at County Hall near the Countrywide Centre, and a 'walk through' at Pershore.
There is also a COVID testing station at the Worcester Royal Hospital for screening patients before admission.
If you cannot get to these you can order a home PCR test kit.
If you test COVID positive you should ideally self-isolate for 5 days or until you feel better.
Getting a Lateral Flow Device test
Lateral Flow Device tests (LFD) can either be booked at Claremont Pharmacy in Barnards Green, Evans Pharmacy in Malvern Link, or taken at home.
The test is intended to screen those who do not show the classic symptoms of COVID-19 and provides a means to check you are 'virus free' at home - either before visiting an elderly person, going to work, or attending a crowded event. It also provides a means to check whether or not you have Coronavirus if you are feeling poorly with cold and flu like symptoms.
 You
can collect home test kits,
for example packaged as the COVID-19 Self-Test (Rapid Antigen Test) in boxes
of 7 tests, from Malvern library, the Co-op, and most pharmacies such as Boots and Murrays in Church
Street, Claremont House and Lloyds in Barnards Green, Murrays at Prospect
View, Evans and Murrays in Malvern Link, and Boots and Morrisons on the
Enigma Retail Park.
You
can collect home test kits,
for example packaged as the COVID-19 Self-Test (Rapid Antigen Test) in boxes
of 7 tests, from Malvern library, the Co-op, and most pharmacies such as Boots and Murrays in Church
Street, Claremont House and Lloyds in Barnards Green, Murrays at Prospect
View, Evans and Murrays in Malvern Link, and Boots and Morrisons on the
Enigma Retail Park.
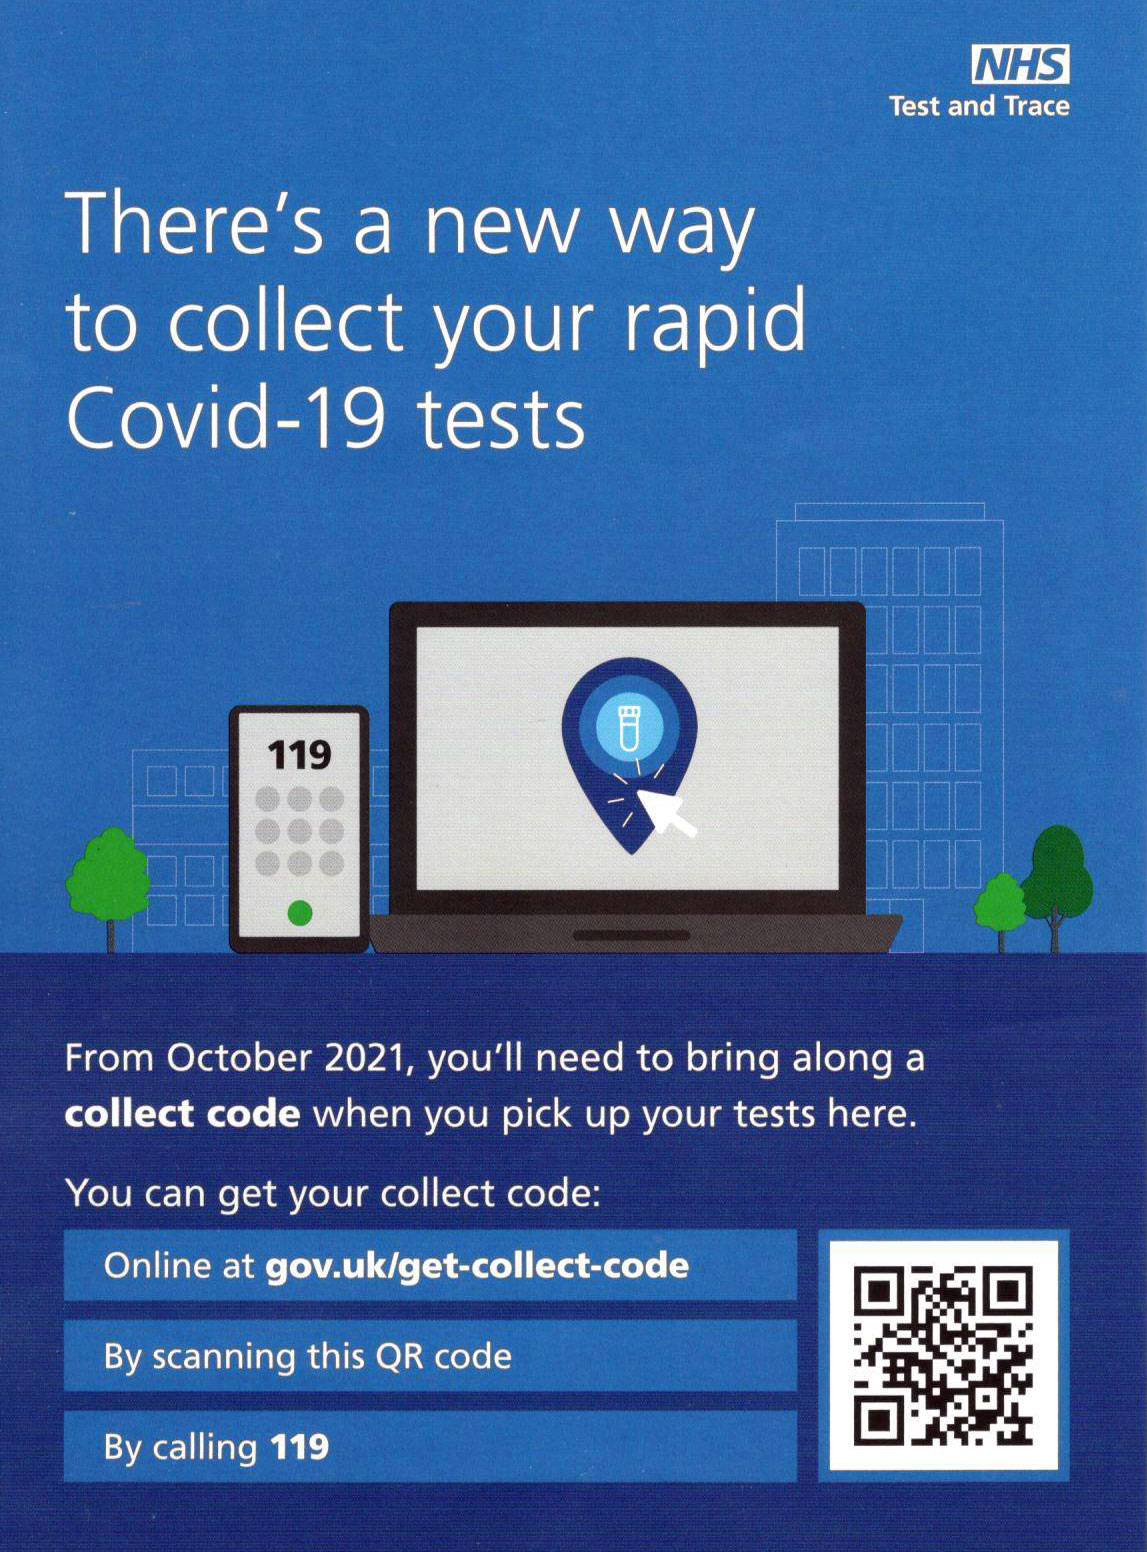
If collecting from a pharmacy you now have to go on-line and get a collection code to present to the pharmacy in order to obtain a pack of 7 tests. This involves giving NHS Test and Trace your email and/or mobile phone number and address.
http://www.gov.uk/get-collect-code
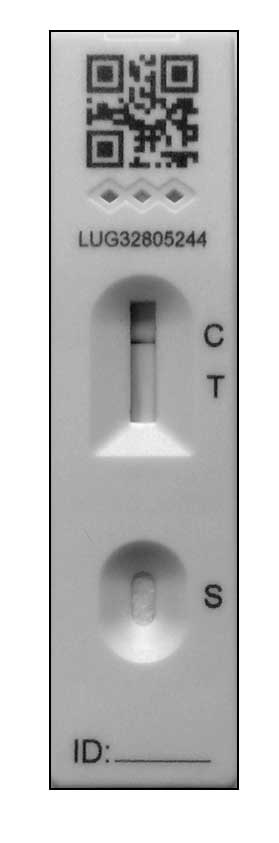
The LFD now comes in two versions.
-
The Throat and Nose Swab kit;
-
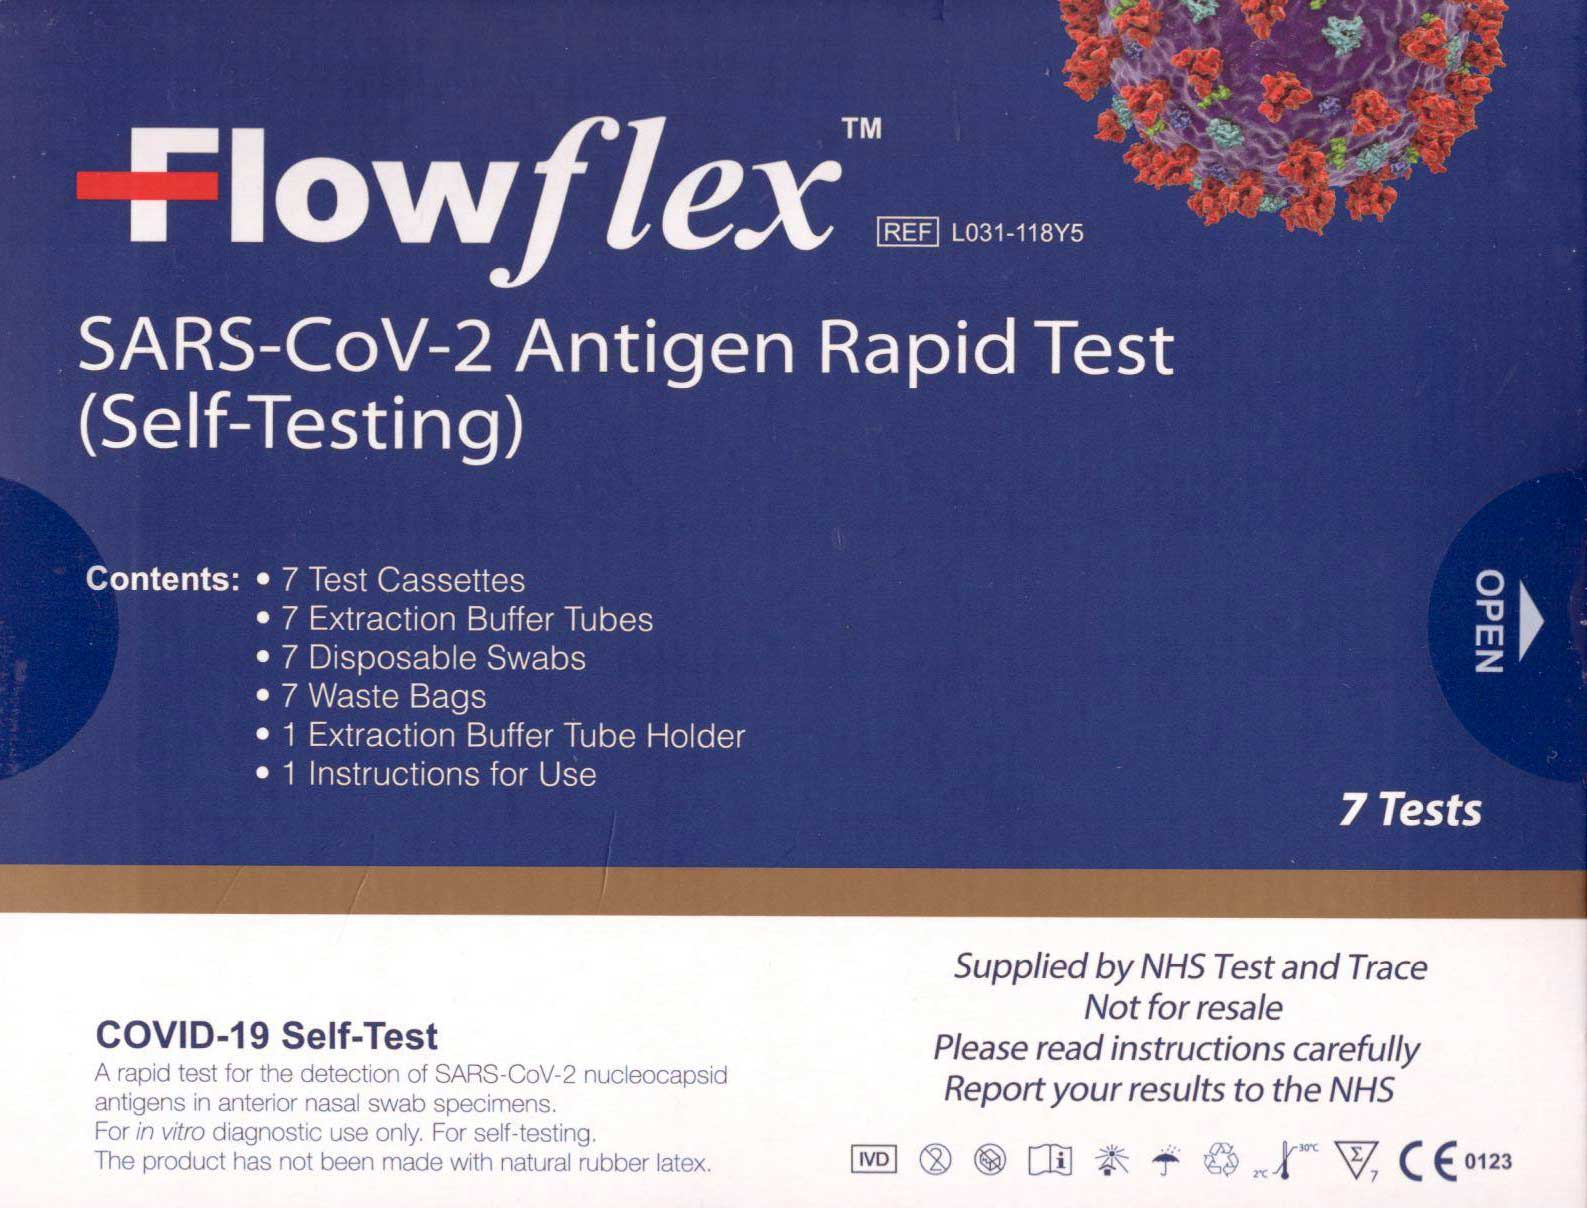
The Nose Swab only kit (Orient Gene, Acon Flowflex and MP Biomedicals).
(Lateral Flow Device cassette shown on the right).
ACON Flowflex comes in a blue and white pack.
Orient Gene comes in a green and white pack.
MP Biomedicals come in a blue, white and grey pack.
Click for instructions for using the LFD test kits
Leaflet at Boots the Chemist
The new Nasal swab test kit which only requires a nose swab is the easiest to use and the best one to get but it is not yet widely available. On 10th November we found Boots in Church Street and Malvern Library were still supplying the old Throat and Nose kit; Murrays in Church Street had the new kits and Malvern library thought the library in St John's Worcester might have the new kits.
Click for NHS information on Rapid Lateral Flow Test sites and collection sites in Malvern
Hint: to see the list, click on 'filter' and then 'pick up sites for test kits' checkbox.
Click for WCC info about Lateral Flow Tests
In our opinion, many Seniors will find the classic Throat and Nose Swab home test kit difficult to use as you need to rub the tonsils or thereabouts with the swab-stick without touching the tongue, teeth, cheeks, gums or any other surface before swabbing the nose. Doing this standing in front of a mirror on your own without gagging while holding a torch in the other hand, won't be easy unless you have a steady hand and good eyesight.
The Nose Swab kit is by far the best one for testing yourself at home.
If you test COVID positive you should isolate and take a more accurate PCR test to confirm the result.
NHS Test and Trace want people to report the result of their home LFD tests within 24 hours at:
www.gov.uk/report-covid19-result
This helps NHS Test and Trace monitor where the issue of the free LFD tests is proving most effective and the spread of the disease.
However, it's tedious to enter your Lateral Flow Test result on the government website and we imagine many people now don't bother.
Nose swab home test kit obtained from Murrays
About the COVID Symptom Study app (Zoe)
![]() You
can help others by downloading the COVID Symptom Study app onto your
smart-phone or Ipad and reporting how you feel either daily, or as you are
able. Note there is no desktop PC version for Windows.
You
can help others by downloading the COVID Symptom Study app onto your
smart-phone or Ipad and reporting how you feel either daily, or as you are
able. Note there is no desktop PC version for Windows.
For further details click this link: https://covid19.joinzoe.com
The Zoe app, which is easy to use, allows you to report whether or not you are feeling well and if you have had a test for COVID. This helps Kings College London monitor the spread and symptoms of the disease and give advice to government. This is an important source of data as we progress through the EXIT wave.
There are questions allowing you to enter your vaccine type and whether any side effects; this now includes boosters and flu jabs.
About the NHS COVID-19 contact tracing app (England)
Release of the NHS COVID-19 contact tracing app for Apple and Android smartphones was announced on 24th September 2020.
Click this link for NHS Coronavirus app information
If you have been close to someone who has tested COVID positive, your smart-phone will be pinged and you may be advised to self-isolate
Note: isolation is no longer a legal requirement.
About the NHS app and Covid Pass
An NHS COVID Pass shows your coronavirus (COVID-19) vaccination details and/or test results. This is your COVID-19 status. You may be asked to show your pass to travel abroad
You will need the NHS app installed on your smartphone and be registered with the NHS in order to display your vaccination status.
Note: this is not the NHS COVID-19 app
If you don't have a smartphone you should be able to login from a PC to obtain a printed copy.
Click to login from a desktop computer or laptop
You can use your NHS login when signing in to report the result of Lateral Flow Device tests taken at home; this has to be done within 24 hours.
Summary of Links
Information about Coronavirus can be found on the NHS website:
https://www.nhs.uk/coronavirus
Symptoms
Article about the effects of Coronavirus on the human body
Reporting and how to obtain a test
How to get a test
https://www.nhs.uk/coronavirus
About joining the Zoe COVID Symptom Study:
Guidance
UK government Coronavirus guidance
COVID-19 Response: Autumn and Winter Plan 2021 for England
UK Health and Security Agency (UKHSA) website
COVID Alert states
Guidance on UK COVID-19 alert level methodology: an overview
COVID-19 Alert Level lowered to 3 on 10th May 2021
Tiers
Guidance on tiers: what you need to know
Government postcode checker to find tier for other areas
Statistics
UK government COVID-19: Omicron daily overview
UK government Coronavirus Dashboard
Coronavirus Dashboard Interactive Map
ONS data on deaths in England and Wales (Excel spreadsheet)
NHS England COVID-19 Daily Deaths
NHS England COVID-19 Hospital Admissions
NHS England vaccination statistics
Worcestershire Coronavirus Dashboard
Worcestershire COVID-19 Vaccinations Dashboard
HSA COVID-19 vaccine weekly surveillance reports
Information about NHS hospital bed numbers: past, present, future
A glimpse of the worldwide vaccination situation can be found on the Our World in Data website.
Click for chart showing % vaccinated
Modelling
A forecast of the progression of the COVID-19 epidemic can be found on a University College London (UCL) website.
Click for UCL Long-term forecasting of the COVID-19 epidemic
A projection of the future COVID-19 death toll and daily deaths can be found on The Institute for Health Metrics and Evaluation website.
Click for IHME projection of COVID-19 deaths
Reports
Coronavirus (COVID-19) latest insights by ONS
A live roundup of the latest data and trends about the coronavirus (COVID-19) pandemic from the ONS and other sources.
The bigger picture
Worldometer summary of coronavirus cases worldwide
European Centre for Disease Prevention and Control info
https://www.ecdc.europa.eu/en/geographical-distribution-2019-ncov-cases
World Health Organisation info
Window on the USA
Centre for Disease Control (CDC)
Find maps and charts tracking cases, deaths, and trends of COVID-19 in the United States.
American Association of Retired People (AARP)
Worcestershire
Help:
http://www.worcestershire.gov.uk/here2help
Worcestershire County Council COVID-19 information:
http://www.worcestershire.gov.uk/coronavirus
Here you will find a useful link,
'Website: Number of new cases by date in Worcestershire'
which displays interesting COVID charts and statistics for Worcestershire
Miscellaneous
Spanish Flu
Dr Jeff Kildea's commentary about the 1919 outbreak of Spanish Flu in Australia
Views of Martin McKee, Professor of European Public Health
Follow Martin McKee on Twitter
SAGE membership
Scientific Advisory Group for Emergencies (SAGE)
Scottish government:
Link to Scottish Government website
Link to Postcode checker for COVID restrictions by protection level in areas of Scotland
Welsh Government:
Guidance on COVID alert levels in Wales
![]()
The interpretations and opinions expressed are our own
Last updated 6th March 2022