Angus and Rosemary's Miscellany
of Malvern - Other Resources
|
Coronavirus (COVID-19) epidemic weekly update for Malvern SeniorsClick to read our observations on politics and world events 6th November 2022
Those aged 50+ years can book Autumn booster vaccinations PreambleFor more than two years we have been keeping an eye on the published government figures and monitoring the media to asses the likely level of risk for Seniors in the Malvern Hills district and providing links to where further information could be found. During the epidemic Public Health England was split into the UK Health Security Agency and Office for Health Improvements and Disparities. However for simplicity, in this blog, we have continued to refer to this as PHE data. Testing has been run down and the public can no longer record the result of Lateral Flow tests so the daily cases reported on the Coronavirus Dashboard greatly underestimate the actual situation, and we have deleted our section on testing; this can however be found on archived pages. The only remaining sources of data indicating direction of travel are:
Now the epidemic seems largely over in the UK the numbers are of less importance, but we'll carry on with our blog for a little while longer. As sections become no longer relevant we are deleting them, but you can always refer back to archived pages. This page will continue to be updated each weekend using Friday's data, nominally with Sunday's date. ContentsSummaryThe current, let us call it, Autumn Wave of COVID appears to have peaked and NHS COVID bed occupancy in England is falling, but what we don't know is how fast and how deeply cases will dip before the roller-coaster ride takes another upward turn. The incidence of COVID remains high which is a good reason to take care; test if you still have Lateral Flow Tests; and take any necessary precautions to limit the spread. For example, do not attend meetings in person if you are feeling poorly. For most, COVID no longer represents a critical threat to health. In Worcestershire relatively few people are being admitted to hospital with severe illness and no more than a dozen patients a week, and typically half that, are dying in a population of approximately 600,000. Death rateAfter dipping to somewhere between 230 and 300 deaths per week the COVID death rate in England and Wales has risen to 687 tracking the recent Autumn Wave of infections. Now the Autumn Wave has peaked and hospital admissions are falling, the death rate should drop, at least for a week or two. University College London modelling suggests the Autumn Wave could be followed by a Winter Wave ramping up in late November and peaking in January 2023. If that comes about, weekly deaths might fall no further than 350 before possibly rising towards 1,000 in January. That's a lot, but nothing for most people in good health to be concerned about. Winter wave of COVID-19The present Autumn Wave peaked last week, but this could soon be followed by a Winter Wave peaking in the New Year. COVID is unlikely to restrict celebrations this Christmas - though sadly increased travel and mingling will almost certainly lead to increased infections and unwanted additional deaths in January 2023. What happens if you get sickBecause the vaccines rarely stop people catching COVID and prevalence is rising do not be surprised if you catch COVID despite being fully vaccinated. Infection 12 months ago rarely stops people getting sick for a second time. Some may either show no symptoms or have a mild fever, sore throat, general aches and pains, and quickly get over it; while others could feel quite poorly and spend between two and five days in bed, with it taking five to ten days or so to recover. Many of those who have caught COVID report either getting easily tired or suffering from shortness of breath for some weeks afterwards; if so patients are advised to take it easy until fully recovered. PrecautionsAny precautions to take are now a personal decision. The bookmark below will take you to the Worcestershire County Council webpage links at the end - there is little new to see. Click for Worcestershire Dashboard and associated links Booster shotsAn Autumn booster jab is being offered to all those aged 50+ years and patients designated Clinically Extremely Vulnerable, such as with a severely weakened immune system. Note: you should not book if it is less than 3 months since your last vaccination or you have had COVID within the last 2 weeks. Seniors are advised to get both the COVID booster and flu jabs in order to reduce the likelyhood of severe illness and hospitalisation. The NHS advises it is safe to have both jabs at the same time, but to minimise side effects you might want to consider having them a week apart. Take up is good. Independent SAGE say 74% of those aged 65+ years in England have already had their COVID Autumn Booster. Either the NHS or your GP Surgery (or both) should contact you when it is your turn to book; either by email, text message or letter. You should not need to contact them. The arrangements for getting vaccinated have changed slightly with the rollout of Autumn boosters. According to SW Healthcare, representing GP Surgeries, the centre at the Three Counties Showground has closed and vaccinations will either be at GP Surgeries, or at walk-in 'Pop-Up' Clinics, else roving 'Vaccine Vans' which are otherwise known as 'Jab-Vans'. That is not the complete picture as some pharmacies such as Claremont House in Barnards Green and Evans in Malvern Link will also be offering walk-in and timed appointments. To book an Autumn Booster on-line:- Click for NHS National Booking Service Note: you may sometimes have to travel out of town to get an Autumn booster appointment, depending on vaccine availability. Alternatively you can wait to be contacted by your GP Surgery and in due course get your Flu vaccine at the same time. Don't forget to check the mobile phone you have registered with your GP surgery for text messages. If you think you have been forgotten or don't have a mobile phone, phone your GP surgery to book an appointment. Our email from the NHS included a link for finding walk-in centres: Click this NHS link to find a walk-in coronavirus (COVID-19) vaccination site Depending on availability you could be offered either of the original Pfizer and Moderna vaccines, or the new Pfizer and Moderna bivalent vaccines which protect against both the original Wuhan strain and Omicron BA.1. The SW Healthcare website explains the Worcestershire arrangements that are gradually being put in place by GPs in conjunction with NHS Herefordshire and Worcestershire. Click for SW Healthcare information about where to get your vaccination in Worcestershire Hint: click Vaccine Rollout on the navigation bar at the top of the page and then Vaccine Van for pop-ups. When we last looked pop-up venues for Malvern had been deleted from the calendar. The nearest is St Peter's Baptist church near Tesco on the outskirts of Worcester. In summary, if you want to get your Autumn booster you can either book an on-line appointment, possibly having to travel out of town, look for a local walk-in centre such as Claremont House and Evans Pharmacies, look for a pop-up, or perhaps easiest contact your GP Surgery and book your flu jab at the same time. Vaccination SitesThe NHS England website has a spreadsheet updated 5th October 2022 listing vaccination centres under the categories:
Note: this does not mention plans for pop-ups or vaccination-vans. Click for NHS England Vaccination Sites Two pharmacies in Malvern are listed Evans in Malvern Link, and Claremont House in Barnards Green. Prospect View is the only GP Health centre listed in Malvern. (No information listed for Whiteacres Medical Centre, Malvern Link; do tell us if you know) Upton Surgery is used by some residents of Malvern and surrounds. The Malvern Showground remains listed as a Vaccination Centre despite SW Healthcare saying it has closed. If you know the situation there do please let us know. No hospital hubs are listed for Worcestershire. Note: for historical information about how to get vaccinated, which may be out of date, select an archived report eg Go to 'How to Get Vaccinated' section of the 7th August 2022 blog
|
| Date report published | Prevalence (England) | Ratio of people with COVID |
| 16th September 2022 | 705,800 | 1:75 |
| 23rd September 2022 | 766,500 | 1:70 |
| 30th September 2022 | 857,400 | 1:65 |
| 7th October 2022 | 1,105,400 | 1:50 |
| 14th October 2022 | 1,513,700 | 1:35 |
| 21st October 2022 | 1,706,200 | 1:30 |
| 28th October 2022 | 1,748,400 | 1:30 |
| 4th November 2022 | 1,593,900 | 1:35 |
Prevalence of COVID-19 in England estimated by ONS
Compare with similar prevalence in Scotland (1:35), Wales (1:40), and Northern Ireland (1:30).
Zoe Health Study
The ZOE Health Study estimates are shown in the following table.
| Date of screenshot | Prevalence (UK) | Estimated new infections per day |
| 26th August 2022 | 1,584,981 | 102,457 |
| 3rd September 2022 |
1,488,559 | 106,548 |
| 9th September 2022 | 1,531,318 | 118,448 |
| 16 September 2022 | 1,633,830 | 125,909 |
| 22nd September 2022 | 1,794,310 | 148,830 |
| 29th September 2022 | 2,116,791 | 184,293 |
| 6th October 2022 | 2,579,954 | 224,316 |
| 13th October 2022 | 3,014,668 | 235,829 |
| 20th October 2022 | 3,075,997 | 203,224 |
| 28th October 2022 | 2,778,154 | 178,336 |
| 3rd November 2022 | 2,578,788 | 166,791 |
Prevalence of COVID-19 in UK estimated by the Zoe Health Study
According to the later Zoe figures estimated prevalence and daily cases fell by just 7% in the UK since last week's update.
This is confirmed by falling hospital admissions and Hospital bed occupancy.
Numbers testing COVID positive in Worcestershire (PHE)
Note: this section has been deleted due to COVID testing being run down in the UK; figures can still be found on the Worcestershire Coronavirus dashboard, but these greatly underestimate the true number of infections.
Click for Worcestershire Coronavirus Dashboard
 Number
of deaths
Number
of deaths
Statistics on COVID deaths are published by Public Health England, The Office of National Statistics, and NHS England. These can't be directly compared as they cover different periods, but together the figures paint a picture of the direction of travel - which is that COVID weekly deaths will soon peak and begin to fall.
PHE figures
The Dashboard chart of COVID (28) deaths, following a positive test, by date of death shows that the 7 day average peaked in England at 144, then gradually falling to 126 by 24th October.
Click to view the UK government Coronavirus Dashboard
ONS figures
The Office of National Statistics (ONS) reports registered deaths in England and Wales where COVID-19 is mentioned somewhere on the death certificate. The ONS figures lag the PHE figures by 10 - 14 days and do not include Northern Ireland and Scotland.
Note: the figures include cases where COVID may have been a secondary cause of death.
Click for national ONS data on deaths (Excel spreadsheet)
The ONS figures are broken down by District providing a glimpse of where deaths are occurring. The provisional cumulative total of COVID related deaths in Worcestershire reported by the ONS up to 21st October (week 42 of 2022) is shown below.
Note: the numbers are now derived from Table 1 of the ONS Death Registrations spreadsheet using the in-built filters. This gives the provisional total of deaths registered in any week, which can be distorted by delayed reporting, for example, due to public holidays.
Deaths by Welsh Health Boards are excluded to avoid duplication as these are totals of Local authorities.
Death occurrences by 'date of death' is a more accurate metric but takes longer to be confirmed.
| Districts of Worcs |
Deaths 2020 |
Deaths 2021 |
Deaths 2022 |
Week 42 | Population |
| Bromsgrove | 164 | 142 | 55 | 2 | 98,529 |
| Malvern Hills | 61 | 98 | 64 | 0 | 77,545 |
| Redditch | 108 | 109 | 43 | 2 | 85,317 |
| Worcester | 87 | 134 | 47 | 0 | 103,542 |
| Wychavon | 157 | 154 | 77 | 0 | 126,240 |
| Wyre Forest | 171 | 132 | 58 | 5 | 100,957 |
| TOTAL | 748 | 769 | 344 | 9 | 592,130 |
Provisional cumulative COVID-19 deaths in Worcestershire registered by ONS to 21st October 2022.
There were 2 deaths in hospital in Bromsgrove; 2 deaths in hospital in Redditch; and 5 deaths in hospital in Wyre Forest (Kidderminster).
In England and Wales 687 COVID-19 related deaths were reported in the week to 21st October, 124 more than the week before and a rise of 22%. Of these 73 were in care homes, 42 at home, 18 in a hospice, 549 in hospital and 5 elsewhere.
So far this year in England and Wales 28,625 people have died with COVID mentioned on their death certificate.
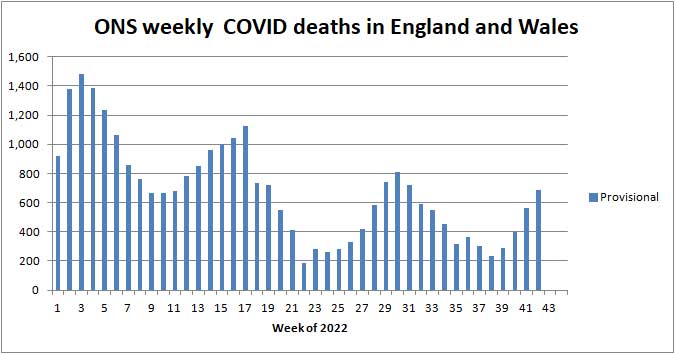
ONS provisional deaths 'by week reported' in England and Wales 2022
Note: steps in the chart above are caused by delayed reporting over public holidays.
The rise in the death rate over the last 3 weeks was to be expected following the surge in cases which we will call the Autumn Wave. In a week or so deaths should begin to fall as hospital admissions subside.
The figures on the Coronavirus Dashboard of ONS deaths by date on the death certificate show ONS England deaths peaked at 120 deaths per day on 18th July; gradually falling to a 7 day average of 30 deaths per day by 9th September, since risen to 75 on 7th October. This metric is the most reliable measure of deaths and can be expected to rise a little further peaking towards the end of October.
In comparison averaged over recent years 1,700 people die daily from all causes in the UK.
Click for ONS Coronavirus (COVID-19) latest insights: Deaths
NHS England figures for Worcestershire
The table below shows the latest COVID deaths in Worcestershire hospitals reported by NHS England on 3rd November 2022.
| Worcestershire | Cumulative deaths | Past week |
| Acute hospitals | 1,193 | 5 |
| Care hospitals | 87 | 4 |
| TOTAL | 1,280 | 9 |
Excludes deaths in care homes, deaths at home and deaths in hospices.
Once again deaths are up a bit.
Click for NHS COVID-19 total announced deaths
Look for COVID Total announced deaths file, then select tab Deaths by Trust.
Note: NHS say all deaths are recorded against the date of death rather than the date the deaths were announced. As from 1st July 2022 reporting has moved to publication once per week on a Thursday, rather than every weekday.
Trend in Worcestershire COVID deaths this year (overview)
Since 1st January 2022 there has been a baseline level of up to 1 COVID death per day in NHS Worcester acute hospitals.
A peak of typically up to 3 deaths per day occurred either side of 1st April, with a more recent upturn of up to 2 deaths per day during July 2022. On some days no deaths were reported.
With a Worcestershire population of roughly 600,000 and assuming one COVID death per day that equates to 0.06% COVID deaths per year. Taking into account that most deaths are of the elderly the risk of Seniors dying of COVID this year will probably be less than 0.5%.
Worcestershire represents about 1% of the population of England, so all other factors being equal, one might expect the Worcestershire death rate to be one hundredth of the figure for England.
England peaked at about 800 (ONS) deaths per week at the end of July but now no more than 400, so for Worcestershire assume a pro rata average of fewer than 4 deaths per week.
To get things in perspective, at the present time, Seniors are 30 times more likely to die of something else, for example cancer, heart attack, stroke, and old age.
For that reason most people now seem to be taking the view that COVID is no longer a critical threat to their health.
Risk of COVID-19 death by age band
NHS England provides an analysis of COVID-19 deaths in hospital in England and Wales by age band. Shown below is a snapshot of 2,898 recent deaths for the period 6th May 2022 to 6th July 2022 when most of these deaths will have been from the Omicron variants.
| Age band | Number of COVID deaths | % of deaths |
| 0 - 19 | 8 | 0.3 |
| 20 - 39 | 25 | 0.9 |
| 40 - 59 | 165 | 5.7 |
| 60 - 79 | 1,010 | 34.9 |
| 80+ | 1,692 | 58.4 |
Relative risk of COVID-19 death by age band May - July 2022
The main point to note is those aged 60+ still account for 93% of deaths despite young people being more likely to catch COVID-19.
The risk profile for Omicron appears to be the same as for Delta. Age is still the greatest risk factor; perhaps reflecting that older people have more health problems.
According to the Coronavirus Dashboard sex is an additional risk factor - males are roughly 50% more likely to die than women.
 Healthcare numbers
The UK government Coronavirus Dashboard includes information about healthcare statistics and NHS bed occupancy.
| Hospital COVID cases (England) | Number | Change in last week |
| Patients currently in hospital | 7,296 | -1,835 |
| Patients on ventilation | 175 | -47 |
| Patients admitted daily | 691 | -250 |
Headline summary of patients in hospital reported on 3rd November 2022
Note: 'Patients admitted daily' is the weekly total divided by 7. This number includes both patients admitted to hospital with COVID-19 from the community, and those diagnosed with COVID-19 in hospital.
See charts on the Coronavirus Dashboard and below.
Bed numbers by region in England
Tabulated figures for COVID bed occupancy in England can be found on the NHS England website and are another indicator of the prevalence of COVID.
Click for NHS England COVID-19 Hospital bed Activity statistics
Note: see the latest Daily Admissions and Beds spreadsheets, then look for all COVID beds.
| Region | 26th October 2022 | 2nd November 2022 | 15th January 2021 |
| England | 9,131 | 7,296 | 33,362 |
| London | 1,327 | 1,238 | 7,811 |
| Midlands | 1,911 | 1,428 | 5,890 |
Comparison of All beds COVID data for England, London and Midlands
In the last week the number of COVID-19 General and Acute beds fell by 20% in England, 7% in London and 25% in the Midlands.
For comparison, the number of beds occupied during the peak of the epidemic in January 2021 is shown in red in the right hand column of the table.
The chart below shows how COVID bed occupancy due to the Autumn Wave peaked in England about 20th October 2022 and is now falling.
The peak in beds is usually one week delayed on the peak in daily admissions, and deaths lag beds by a further week.
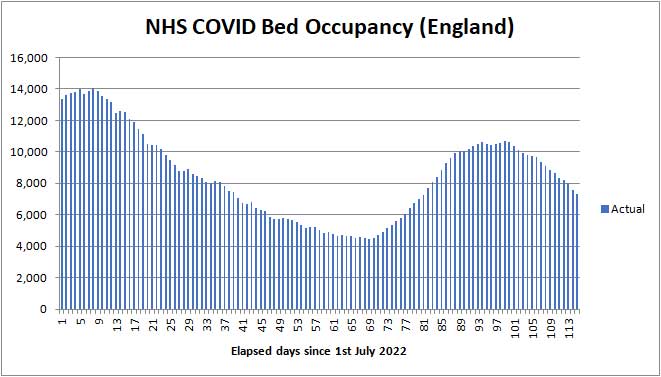
COVID bed occupancy in England from 1st July to 2nd November 2022
 Worcestershire
hospital beds
Worcestershire
hospital beds
Between 25 October 2022 and 31 October 2022, 46 patients went into hospital with coronavirus. This shows a decrease of 2% compared to the previous 7 days. There were 83 patients in hospital with coronavirus on 2 November 2022; the same as the week before, three on a ventilator.
Click for Summary of Malvern numbers on the Coronavirus dashboard
This link also reports deaths.
Deaths in Malvern Hills
Between 23 October 2022 and 29 October 2022, there was 1 death within 28 days of a positive coronavirus test.
Forecast for the week ahead
As a consequence of the Autumn Wave we expect roughly 570 COVID related deaths to be registered in England and Wales (as registered by the ONS) in week 43 ending 28th October, to be reported on 8th November.
In the county of Worcestershire, based on 43 new hospital cases last week and assuming the ratio of all deaths (including those in care homes and at home) to be 1:11 of admissions, then there should be no more than 4 COVID deaths per week in the second half of November.
NHS COVID bed occupancy in England could fall by between 10% and 20% next week.
Longer term outlook (up to Christmas)
According to Independent SAGE there are many new Omicron variants such as BQ.1.1, BQ.1 and BF.7 circulating which now make up about 30% of cases but so far none are seen as a variant of concern which might cause a further wave of COVID.
Factors favouring a possible increase in infections are:
-
new variants which may escape the vaccines to some extent;
-
fewer precautions being taken;
-
vaccines waning in effectiveness especially in the under 50s;
-
mixing of unvaccinated children going back to school after half term;
-
transmission from children to teachers and parents;
-
the general population beginning to spend more time huddled indoors with the windows shut.
These factors are being strongly countered by the Autumn Booster programme, and natural immunity following recent infection.
Hospital admissions, COVID bed occupancy and the Zoe Health Study all indicate the present Autumn Wave is over the worst, but there is no way of knowing how future cases will evolve during the remainder of the winter.
We speculate cases will fall for the next 2 to 3 weeks and later rise due to friends and families mingling in December and the New Year. The remaining profile of the Winter Wave could turn out somewhat like the northern ridge of the Malvern Hills with cases rising again in the New Year.

The northern ridge of the Malvern Hills
Given that COVID hospital bed occupancy peaked at 10,608 beds in England, and has already fallen to 7,296 it's likely the death rate will fall proportionately from 687 to about 475 deaths per week in England and Wales during the next fortnight.
The latest UCL modelling suggests that the death rate may fall to a minimum of 350 deaths per week in November. Cases could then begin to rise once again, peaking in the second half of January, with associated deaths briefly rising towards about 1,000 possibly as high as 1,400 deaths per week. We are now referring to this as the Winter Wave.
Click for UCL Long-term forecasting of the COVID-19 epidemic
Additional deaths due to the Winter Wave
Things don't look too bad. Prior to Christmas the UK COVID-19 death rate looks set to remain below 700 deaths per week. It has been our opinion that as long as the COVID death rate remained below that number neither the public nor the government would be concerned. This threshold now looks unlikely to be exceeded during the remainder of 2022, but could be topped in January and February 2023.
We doubt many will be concerned by a 'blip' - possibly of the order of 10,000 additional UK COVID deaths amongst OAPs this winter. Flu and Excess Deaths (above the normal average) could yet turn out a much greater threat.
To put things in perspective, Worcestershire's share might only be of the order of 100 COVID related deaths.
In a population of 600,000 few will be concerned about that as, barring new variants of concern, the vast majority (we estimate 99.98%) can be expected to survive any winter bout of COVID-19.
Advice for Seniors
We judge the risk of exposure to COVID-19 remains HIGH in England.
See our riskometer opposite.
Despite this many, perhaps most, healthy people will be taking the view that COVID is no longer a critical threat to their health.
For the more cautious and the clinically vulnerable the simple safeguards to remember are to:
-
make sure your COVID and FLU vaccinations are fully up to date
-
wash your HANDS thoroughly, using soap and hot water, for 20 seconds, including after handling deliveries to your home, to kill virus picked up from contaminated surfaces (see note 1);
-
ideally wear either a well fitting FACE covering, or better an FFP2 face mask when in crowded settings for example when in shops, theatres, health-care settings, and when using public transport;
-
SPACE at least 2 metres from people you don't feel safe with (see note 2);
-
preferably socialise with friends and other households outdoors in the FRESH AIR else, if you are indoors, either ventilate by keeping windows open as far as is practicable or consider putting a HEPA air purifier in the room;
-
avoid crowded indoor settings;
-
avoid friends and colleagues with cold and flu like symptoms;
-
ideally self-isolate to protect others if you feel unwell with cold or flu like symptoms; according to the Zoe COVID Study the current top five COVID symptoms are sore throat, runny nose, blocked nose, headache and cough, which may be difficult to distinguish from a common cold; other symptoms may include sneezing, tiredness and muscle aches and pains.
-
respect others and give them space;
Notes:
1) Wash your hands thoroughly before touching your face to avoid transferring virus from contaminated surfaces to your mouth, eyes and nose. If outdoors, wash hands with an alcohol based hand gel.
2) Two metres is further than you think - roughly an arm and a walking stick away.
3) If you are 'clinically vulnerable' consult your GP or specialist; you may need to take a test and consider anti viral drugs if testing positive.
4) However careful you are, don't be too surprised if you catch COVID as the Omicron variants are highly infectious and the Wuhan vaccines give little protection against transmission and infection (although they do reduce the severity of symptoms). No information yet on the efficacy of the new bivalent vaccines.
5) You may still have to take a test and wear a facemask when travelling to some overseas countries.
Annex
Commentary
This week
The present Autumn Wave of cases probably peaked two weeks ago in England as evidenced by hospital admissions beginning to fall. Consequently the associated death rate is probably near its maximum and should begin to fall in the next few days. By how much is an unknown, as University College London thinks there could shortly be a further Winter Wave of cases peaking in January.
This week Dr John Campbell speculates about emerging evidence that COVID-19 may have leaked from a laboratory; the Wuhan Institute of Virology in China.
Click for YouTube video - US Senate, lab origin most likely
Click for interim report - An Analysis of the Origins of the COVID-19 Pandemic
In another video Dr John Campbell asks could COVID-19 have started earlier than thought, noting people around the world were already reporting COVID symptoms in November/December 2019.
Click for YouTube video - Covid could have started earlier than thought
There are suspicions the virus may have started circulating in Wuhan as early as August 2019.
Some think WHO delay in halting air traffic with China could have contributed to the rapid spread of the pandemic, but perhaps this is unfair as the virus may have seeded across the globe before anyone realised there was a problem.
In a third video Dr John Campbell highlights excess deaths, that is deaths above the average for this time of year. In his view deaths are 10 to 15% above what they should be in the UK chiefly due to cardiovascular disease and damage caused by diabetes.
He postulates excess deaths could be an indirect result of the pandemic; for example as a result of patients not getting normal levels of attention and/or long term damage caused to patients by COVID - and thinks it's a scandal the government is not investigating this.
Click for video - Deaths from cardiovascular disease show a significant excess
COVID video updates
Links to updates by Professor Tim Spector of the Zoe Health Study, Independent SAGE and sometimes pundit Dr John Campbell can be found here:-
Click to watch Zoe Health Study fortnightly update on 3rd November 2022 presented by Dr Sarah Berry
This week, Zoe's Chief Scientist Dr Sarah Berry steps in for Tim while he takes a well-deserved break after publishing his latest book Food for Life. She talks about the latest updates from the Intermittent Fasting Study, including who's getting involved and some interesting data on snacking. She also briefly brings you Cold and COVID updates and information on why the fall in cases seems to be slowing down.
Click to watch Independent SAGE weekly update on 4th November 2022
Discussion of Covid safety, especially with regard to the Clinically Extremely Vulnerable (CEV) community making up of the order of 5% of the population, with guests Dr Lennard Lee, Lara Wong and Cathy Finnis, hosted by Dr Stephen Griffin and Prof Sheena Cruickshank, chaired by Prof Anthony Costello with numbers by Prof Christina Pagel.
There seems to be a view that the Critically Vulnerable are not well served.
List of vaccines
Autumn bivalent boosters
A second bivalent vaccine has been approved 3rd September 2022 as a booster by the Medicines and Healthcare products Regulatory Agency (MHRA) after it was found to meet the UK regulator’s standards of safety, quality and effectiveness. The updated booster vaccine made by Pfizer/BioNTech, targeting the Wuhan virus and Omicron BA.1 variant, has been approved for use in individuals aged 12 years and above.
An updated version of the COVID-19 vaccine made by Moderna that targets two coronavirus variants (known as a bivalent vaccine) has been approved for adult booster doses by the Medicines and Healthcare products Regulatory Agency (MHRA) after it was found to meet the UK regulator’s standards of safety, quality and effectiveness.
The earlier vaccine story
Here is the updated list of COVID-19 vaccines ordered by the UK. It looks as though the government has settled on the use of Pfizer and Moderna with Astrazeneca now held in reserve.
Moderna has been offered for Spring Boosters at the Three Counties Showground.
The order for Valneva has been cancelled, but nevertheless it has now been approved for use by MHRA.
Click for BBC report - Valneva Covid vaccine approved for use in UK
Nuvaxoid (Novavax) was approved in February.
The government has signed deals to buy 114 million additional doses of the Pfizer (54M) and Moderna (60M) vaccines to use in 2022 and 2023.
The press announcement goes on to say that 60M doses of Novavax vaccine are expected to be delivered in 2022 and 7.5M doses of GSK/Sanofi, so there seems no intention to cancel these late arrivals.
Click for Guardian report - Novavax expected to be become fourth Covid vaccine available in UK
| COVID-19 vaccine | Doses ordered (million) | Status |
| Pfizer BioNTech, two dose, -70 deg C | 40+60+35 | Approved, deliveries continuing, made in Belgium (EU). An additional 60M doses have been ordered for booster shots for the most vulnerable in the autumn. A further 35M doses were ordered in August 2021 for delivery in 2022. |
| Astrazeneca, two dose, fridge | 100 | Approved for those aged 30+ years; deliveries continuing. Batches made in UK, Belgium and India. |
| Moderna, two dose, -20 deg C | 7+10 | Approved. First deliveries to Wales and Scotland 7th April 2021 then England 13th April; mainly for those aged under 50 years awaiting vaccination. |
| Valneva, two dose | 60+40 order cancelled |
A jab from French company Valneva will be made in Livingston,
West Lothian, Scotland. Order cancelled September
2021. Delivery had been expected to start in second half of 2021. Approved by MHRA April 2022. |
| Janssen, single dose | 20 | Approved, a jab from Belgian firm Janssen, owned by Johnson and Johnson; UK approval 28th May. Order reduced from 30 to 20M. |
| Nuvaxovid | 60 | A jab manufactured by US firm Novavax being made in Stockton-on-Tees UK. Glaxo Smith Kline (GSK) contracted to fill and package vials. Approved by MHRA 3rd Feb 2022. JCVI to advise how vaccine will be used. |
| GSK Sanofi | 60 | Some delay due to adjusting the formula to give better protection to the elderly; expected approval and delivery of 7.5M doses in 2022. |
| Curevac | 50 ? | Contract placed with German company Feb 2021. Possible source of new variant vaccine; disappointing trial results have resulted in the company working on a second generation vaccine. Future uncertain. |
Table of vaccines ordered by the UK government
Summary of Links
Some of this information is now out of date but provides a historical context to the epidemic.
Information about Coronavirus can be found on the NHS website:
https://www.nhs.uk/coronavirus
Symptoms
Note: the list of symptoms was updated on 1st April 2022
Article about the effects of Wuhan Coronavirus on the human body
Reporting and how to obtain a test
How to get a test
https://www.nhs.uk/coronavirus
About joining the Zoe COVID Symptom Study:
Guidance
UK government Coronavirus guidance
See also - government sets out next steps for living with COVID
COVID-19 Response: Autumn and Winter Plan 2021 for England
UK Health and Security Agency (UKHSA) website
COVID Alert states
Guidance on UK COVID-19 alert level methodology: an overview
COVID-19 Alert Level lowered to 3 on 10th May 2021
Tiers
Guidance on tiers: what you need to know
Government postcode checker to find tier for other areas
Statistics
UK government COVID-19: Omicron daily overview
UK government Coronavirus Dashboard
Coronavirus Dashboard Interactive Map
ONS data on deaths in England and Wales (Excel spreadsheet)
NHS England COVID-19 Daily Deaths
NHS England COVID-19 Hospital Admissions
NHS England vaccination statistics
Worcestershire Coronavirus Dashboard
Worcestershire COVID-19 Vaccinations Dashboard
HSA COVID-19 vaccine weekly surveillance reports
Information about NHS hospital bed numbers: past, present, future
A glimpse of the worldwide vaccination situation can be found on the Our World in Data website.
Click for chart showing % vaccinated
Modelling
A forecast of the progression of the COVID-19 epidemic can be found on a University College London (UCL) website.
Click for UCL Long-term forecasting of the COVID-19 epidemic
A projection of the future COVID-19 death toll and daily deaths can be found on The Institute for Health Metrics and Evaluation website.
Click for IHME projection of COVID-19 deaths
Reports
Coronavirus (COVID-19) latest insights by ONS
A live roundup of the latest data and trends about the coronavirus (COVID-19) pandemic from the ONS and other sources.
MedRxiv is a US preprint server for Health Sciences. A depository for reports which have still to be peer reviewed.
COVID-19 rapid guideline: managing the long-term effects of COVID-19
NICE guidance on managing Long COVID
The bigger picture
Worldometer summary of coronavirus cases worldwide
European Centre for Disease Prevention and Control info
https://www.ecdc.europa.eu/en/geographical-distribution-2019-ncov-cases
World Health Organisation info
Window on the USA
Centre for Disease Control (CDC)
Find maps and charts tracking cases, deaths, and trends of COVID-19 in the United States.
American Association of Retired People (AARP)
Worcestershire
A local summary of COVID data can be found on the Worcestershire Coronavirus Dashboard.
Note 1: use the arrow <> buttons at the bottom of the Dashboard screen to move between pages.
Note 2: the figures for COVID cases are becoming meaningless as testing is run down.
Note 3: deaths are on page 7, and hospital beds on page 9.
Click for Worcestershire County Council COVID-19 news
There is a colourful webpage offering advice on learning to live with COVID for those aged under 30 years. 'Rona' is slang for Coronavirus.
Click for The Worcestershire 'Rona' Hub
Click for Simple Summary of Malvern numbers on the Coronavirus dashboard
Miscellaneous
Spanish Flu
Dr Jeff Kildea's commentary about the 1919 outbreak of Spanish Flu in Australia
Views of Martin McKee, Professor of European Public Health
Follow Martin McKee on Twitter
Views of Prof Christina Pagel, a member of Independent SAGE
Follow Christina Pagel on Twitter
SAGE membership
Scientific Advisory Group for Emergencies (SAGE)
Scottish government:
Link to Scottish Government website
Link to Postcode checker for COVID restrictions by protection level in areas of Scotland
Welsh Government:
Guidance on COVID alert levels in Wales
Bibliography
Woolhouse, Professor Mark, The Year the World went Mad, published 2022 by Sandstone Press Ltd, ISBN: 978-1-913207-94-3
Medinger Dez, Altmann Danny, The Long Covid Handbook, Penguin Books, 2022.
![]()
The interpretations and opinions expressed are our own
Last updated 6th November 2022