Angus and Rosemary's Miscellany
of Malvern - Other Resources
|
Coronavirus (COVID-19) epidemic weekly update for Malvern SeniorsNew cut down version Click to read our observations on politics and world events 5th March 2023
Daily cases and deaths no longer of great concern PreambleFor almost three years we have been keeping an eye on the published government figures and monitoring the media to asses the likely level of risk for Seniors in the Malvern Hills district and providing links to where further information could be found. For most people, COVID is no longer a critical threat to health so this a shortened version of our weekly update which will continue to be updated weekly, nominally with Sunday's date, for a few weeks more. ContentsSummaryThe recent mini-wave of cases appears to have peaked as evidenced by hospital bed occupancy levelling off and admissions beginning to fall. The COVID death rate in England and Wales, which is is currently settling at about 400 deaths per week, remains relatively LOW. During March deaths may rise briefly towards 675 per week, tracking the most recent wave of cases, before lowering. For most, it seem as though the threat from COVID-19 has gone away. What happens if you get sick with COVIDIf you are feeling poorly there is now a fair chance it won't be COVID-19 but some other winter respiratory illness; 'bugs and lurgi' of the unknown variety have recently left friends feeling very poorly, sometimes for two to three weeks. If you have a temperature/fever it's more likely Flu. If you have a stash of Lateral Flow Tests you could test yourself at home. However be aware that a negative test does not guarantee you don't have COVID. Whatever the virus best stay at home until you feel better, and wear a face mask to protect others if you do have to go out. Nowadays, you might not know it's COVID and brush it off as just another cold. The top six symptoms reported through the Zoe app are, sore throat, runny nose, blocked nose, sneezing, headache, and cough. A few of those who have caught COVID report either getting easily tired or suffering from shortness of breath for some weeks afterwards; if so patients are advised to take it easy until fully recovered. A small number of patients report debilitating symptoms for months after so-called recovery especially women. For example see Dez Medinger and Danny Altmann's book The Long COVID Handbook in bibliography. PrecautionsNowadays few people are taking precautions - but that may change were the Kraken variant to start spreading rapidly. Keep that facemask handy during February just in case. Vaccination SitesSection deleted as the Autumn 2022 booster campaign closed on 12th February; if necessary refer to archived blogs (see menu of archived pages).
|
| Date report published | Prevalence (England) | Ratio of people with COVID |
| 3rd February 2023 | 799,200 | 1:70 |
| 10th February 2023 | 874,700 | 1:65 |
| 17th February 2023 | 1,054,200 | 1:55 |
| 24th February 2023 | 1,223,000 | 1:45 |
| 3rd March 2023 | 1,298,600 | 1:45 |
Prevalence of COVID-19 in England estimated by ONS
Prevalence was estimated 1:45 in Wales; 1:45 in Scotland; and 1:90 in Northern Ireland.
Zoe Health Study
The ZOE Health Study estimates are shown in the following table.
| Date of screenshot | Prevalence (UK) | Estimated new infections per day |
| 4th February 2023 | 895,560 | 81,770 |
| 9th February 2023 | 996,259 | 90,406 |
| 16th February 2023 | 1,206,030 | 99,032 |
| 23rd February 2023 | 1,277,787 | 92,168 |
| 2nd March 2023 | 1,271,693 | 88,670 |
Prevalence of COVID-19 in UK estimated by the Zoe Health Study
According to the more recent Zoe figures, estimated prevalence has fallen by just 0.5%, while daily cases fell by 4% in the last week.
The Zoe chart suggests prevalence has reached a plateau and will slowly begin to fall.
This correlates with Hospital bed occupancy no longer rising and possibly beginning to fall.
Note: the Zoe numbers were rebased on 3rd February 2023 to better align with ONS figures.
 Number
of deaths
Number
of deaths
Statistics on COVID deaths are published by Public Health England, The Office of National Statistics, and NHS England. These can't be directly compared as they cover different periods, but together the figures paint a picture of the direction of travel - which is that the Winter Wave death rate peaked around 1st January 2023 and is now approaching a minimum, following which the death rate could rise a little during March.
PHE figures
The Dashboard chart of COVID (28) deaths, following a positive test, by date of death shows that the 7 day average peaked in England at 167 deaths per day around 30th December; marking the peak of the Winter Wave.
Since then deaths fell, and flat-lined at about 90 deaths per day in the fortnight ending 13th February before rising slightly to 95 deaths per day in week ending 20th February.
Click to view the UK government Coronavirus Dashboard
The PHE figures include people who die with COVID but not from it so are likely to be higher than the ONS numbers.
ONS figures
The Office of National Statistics (ONS) reports registered deaths in England and Wales where COVID-19 is mentioned somewhere on the death certificate. The ONS figures lag real time by 10 - 14 days due to the administrative delay in submitting and processing reports, and do not include Northern Ireland and Scotland.
Note: the figures include cases where COVID may have been a secondary cause of death.
Click for ONS data on deaths (Excel spreadsheet)
The ONS figures are broken down by Local Authority providing a glimpse of where deaths are occurring. The provisional cumulative total of COVID related deaths in Worcestershire reported by the ONS up to 17th February (week 7 of 2023) is shown in the table below.
Note: the numbers are now derived from Table 1 of the ONS Death Registrations spreadsheet using the in-built filters. This gives the provisional total of deaths registered in any week, which can be distorted by delayed reporting, for example, due to public holidays.
Deaths by Welsh Health Boards are excluded to avoid duplication as these are totals of Local authorities.
| Districts of Worcs |
Deaths 2020 |
Deaths 2021 |
Deaths 2022 |
Deaths 2023 |
Week 7 | Population |
| Bromsgrove | 164 | 142 | 59 | 11 | 0 | 98,529 |
| Malvern Hills | 61 | 98 | 74 | 7 | 1 | 77,545 |
| Redditch | 108 | 109 | 47 | 10 | 2 | 85,317 |
| Worcester | 87 | 134 | 51 | 4 | 0 | 103,542 |
| Wychavon | 157 | 154 | 85 | 11 | 3 | 126,240 |
| Wyre Forest | 171 | 132 | 62 | 7 | 1 | 100,957 |
| TOTAL | 748 | 769 | 378 | 50 | 7 | 592,130 |
Provisional cumulative COVID-19 deaths in Worcestershire registered by ONS to 17th February 2023.
There was 1 death in a care home in the Malvern Hills; 2 deaths in hospital in Redditch; 3 deaths in hospital in Wychavon; and 1 death in hospital in Wyre Forest.
The general picture continues to be of a 'handful' of weekly deaths in Worcestershire.
In England and Wales 414 COVID-19 related deaths were reported in the week to 17th February, 32 less than the week before and a fall of 7%. Of these 59 were in care homes, 31 at home, 17 in a hospice, and 307 in hospital.
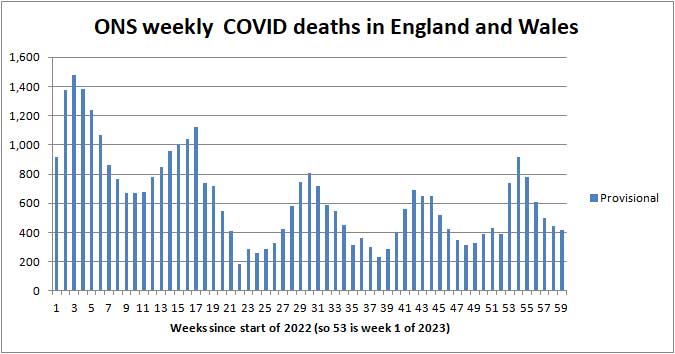
ONS provisional deaths 'by week reported' in England and Wales since the start of 2022 (so week 53 is week 1 of 2023)
The cumulative total of 2023 COVID deaths registered by ONS in England and Wales to 17th February is 4,371.
ONS figures by date of death
Table 2 of the ONS spreadsheet gives England and Wales figures by date of death. This is a more accurate metric but it takes an additional two to three weeks for most of the registrations to flow in; see extract in the table below.
| Week of 2023 | Number of deaths reported last week |
Number of deaths reported this week |
| 1 | 799 | 806 |
| 2 | 680 | 685 |
| 3 | 567 | 569 |
| 4 | 438 | 441 |
| 5 | 400 | 414 |
| 6 | 287 | 373 (incomplete) |
| 7 | - | 271 (incomplete) |
ONS weekly deaths in England and Wales - 'by date of death'
The peak of the Winter Wave appears to be settling at about 800 deaths per week.
Of the 414 deaths reported in week 7, only 271 deaths were in that week. The latter figure will rise as reports of deaths in that week continue to flow in. Once the total this week is close to the total the previous week, the number 'by date of death' can be considered fairly stable.
For example, weekly deaths in week 5 could end up about 425, while those in weeks 6 and 7 could end up about 400.
It looks as though weekly deaths by date of death, in England and Wales, may be reaching a plateau of about 400 after which the death rate can be expected to rise a little, tracking historic hospital admissions.
Comparison with deaths from all causes
Averaged over recent years roughly 1,700 people die daily from all causes in the UK, so currently COVID deaths are about 4% of all deaths.
Many of these are said to be people who die a few months earlier than they might otherwise do. COVID is perhaps an extra burden which pushes the very frail over the edge.
Click for ONS Coronavirus (COVID-19) latest insights: Deaths
NHS England figures
Daily COVID hospital death figures in England show some scatter, but charting them confirms the daily death rate peaked about 1st January 2023 and that since then the daily death rate has fallen by roughly 50%.
NHS England figures for Worcestershire
The table below shows the latest COVID deaths in Worcestershire hospitals reported by NHS England on 2nd March 2023.
| Worcestershire | Cumulative deaths | Past week |
| Acute hospitals | 1,264 | +2 |
| Care hospitals | 96 | +0 |
| TOTAL | 1,360 | +2 |
Excludes deaths in care homes, deaths at home and deaths in hospices.
Only 2 deaths reported this week.
Note: the increase is the difference between this week's cumulative total and that last reported.
Click for NHS COVID-19 total announced deaths
Look for COVID Total announced deaths file, then select tab Deaths by Trust.
Note: NHS say all deaths are recorded against the date of death rather than the date the deaths were announced. As from 1st July 2022 reporting has moved to publication once per week on a Thursday, rather than every weekday.
Risk of COVID-19 death by age band
NHS England provides an analysis of COVID-19 deaths in hospital in England and Wales by age band. Shown below is a snapshot of 2,898 deaths for the period 6th May 2022 to 6th July 2022 when most of these deaths will have been from the Omicron variants.
| Age band | Number of COVID deaths | % of deaths |
| 0 - 19 | 8 | 0.3 |
| 20 - 39 | 25 | 0.9 |
| 40 - 59 | 165 | 5.7 |
| 60 - 79 | 1,010 | 34.9 |
| 80+ | 1,692 | 58.4 |
Relative risk of COVID-19 death by age band May - July 2022
The main point to note is those aged 60+ still account for 93% of deaths despite young people being more likely to catch COVID-19.
The risk profile for Omicron appears to be the same as for Delta. Age is still the greatest risk factor; perhaps reflecting that older people have more health problems.
According to the Coronavirus Dashboard sex is an additional risk factor - males are roughly 50% more likely to die than women; possibly because women have a stronger immune system
 Healthcare numbers
The UK government Coronavirus Dashboard includes information about healthcare statistics and NHS bed occupancy.
| Hospital COVID cases (England) | Number | Last week |
| Patients currently in hospital | 7,507 | -508 |
| Patients on ventilation | 175 | +11 |
| Patients admitted daily | 844 | -53 |
Headline summary of patients in hospital reported on 2nd March 2023
The present mini wave of COVID appears to have peaked.
Note: 'Patients admitted daily' is the weekly total divided by 7. This number includes both patients admitted to hospital with COVID-19 from the community, and those diagnosed with COVID-19 in hospital.
See charts on the Coronavirus Dashboard and below.
Bed numbers by region in England
Tabulated figures for COVID bed occupancy in England can be found on the NHS England website providing another indicator of the prevalence of COVID.
Click for NHS England COVID-19 Hospital bed Activity statistics
Note: see the latest Daily Admissions and Beds spreadsheets, then look for all COVID beds.
| Region | 23rd February 2023 | 2nd March 2023 | 15th January 2021 |
| England | 8,015 | 7,507 | 33,362 |
| London | 1,264 | 1,251 | 7,811 |
| Midlands | 1,539 | 1,467 | 5,890 |
Comparison of All beds COVID data for England, London and Midlands
In the last week the number of COVID-19 General and Acute beds fell by 6% in England, 1% in London and 5% in the Midlands.
For comparison, the number of beds occupied during the peak of the epidemic in January 2021 is shown in red in the right hand column of the table.
The chart below shows how COVID bed occupancy appears to have stopped rising in the last week. There is an unusual small step in the data, possibly linked to NHS strikes.
Note: the peak in beds is usually one week delayed on the peak in daily admissions, and deaths roughly lag beds by a further week.
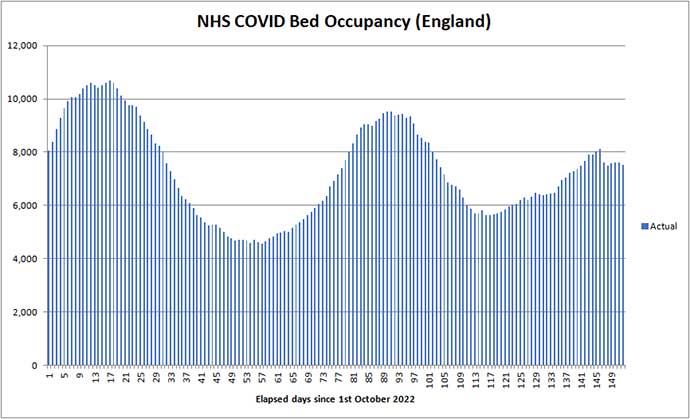
COVID bed occupancy in England from 1st October to 23rd February 2023
 Worcestershire
hospital beds
Worcestershire
hospital beds
Between 21 February 2023 and 27 February 2023, 35 patients went into hospital with coronavirus. This shows an increase of 20% compared to the previous 7 days. There were 49 patients in hospital with coronavirus on 1 March 2023 ten more than the week before; one on a ventilator.
Click for Summary of Malvern numbers on the Coronavirus dashboard
This link also reports deaths.
Deaths in Malvern Hills
Between 19 February 2023 and 25 February 2023, there were no deaths within 28 days of a positive coronavirus test.
Forecast for the week ahead
COVID related weekly deaths registered in England and Wales are expected to flat-line at about 400 in week 8 of 2023 to be reported by the ONS on 7th March.
In the county of Worcestershire, based on 35 new hospital cases last week and assuming the ratio of all deaths (including those in care homes and at home) to be 1:11 of admissions, then one might expect no more than 3 COVID deaths per week in the middle of March 2023.
NHS COVID bed occupancy in England may fall slightly next week.
Longer term outlook
The weekly COVID ONS death rate (by date of death) in England and Wales peaked at about 800 deaths per week around 1st January 2023 roughly coinciding with a peak in hospital bed occupancy of 9,500.
Hospital bed occupancy is now around 7,507 beds and possibly beginning to fall. Historic cases suggest the ONS death rate will begin creeping up from 400 peaking at about 675 deaths per week in the first half of March before falling towards 630.
The present wave of cases appears to have peaked so it is likely hospital bed occupancy will fall next week.
There seems a fair chance that the COVID death rate will remain 'acceptably low' (which we define as below 100 COVID deaths per day) until at least Autumn 2023.
UCL modelling
The latest UCL projection is that the 7-day average of daily (certified) deaths should fall to about 50 per day (350 per week) and peak at around 100 per day (700 per week) about 6th April 2023.
Based upon present trends, that projection looks credible.
Click for UCL Long-term forecasting of the COVID-19 epidemic
Advice for Seniors
We judge the risk of exposure to COVID-19 is MODERATE in England, while there are many other seasonal respiratory viruses circulating that could make you feel just as sick.
We see no evidence that COVID is currently causing alarming numbers of people in Worcestershire to fall severely ill; so for most, the risk might perhaps now be considered LOW.
Consequently we have taken the plunge and moved our riskometer to LOW for the first time since the pandemic started (see opposite).
Many, perhaps most, healthy people continue to take the view that COVID is no longer a critical threat to their health.
For the more cautious the simple safeguards to protect against all respiratory infections, are to:
-
make sure your vaccinations are up to date;
-
wash your HANDS thoroughly, using soap and hot water, for 20 seconds, including after handling deliveries to your home, to kill virus picked up from contaminated surfaces (see note 1);
-
ideally wear either a well fitting FACE covering, or better still an FFP2 (N95) face mask when in crowded settings for example when in shops, theatres, health-care settings, when using public transport, and travelling by air;
-
SPACE at least 2 metres from people you don't feel safe with (see note 2);
-
preferably socialise with friends and other households outdoors in the FRESH AIR else, if you are indoors, either ventilate by keeping windows open as far as is practicable or consider putting a HEPA air purifier in the room;
-
avoid crowded indoor settings and friends and colleagues with cold and flu like symptoms;
-
stay at home to protect others if you yourself feel unwell with cold or flu like symptoms;
-
respect others and give them space;
Notes:
1) Wash your hands thoroughly before touching your face to avoid transferring virus from contaminated surfaces to your mouth, eyes and nose. If outdoors, for example filling the car up with fuel, either wash hands with an alcohol based hand gel after touching suspect surfaces or wear gloves.
2) Two metres is further than you think - roughly an arm and a walking stick away.
3) If you are 'clinically vulnerable' consult your GP or specialist; you may need to take a test and consider anti viral drugs if testing positive.
Annex
Commentary
NHS hospital COVID bed occupancy reached a plateau last week and hospital admissions have started falling.
It is likely the death rate will rise to about 675 deaths per week in England and Wales, tracking historic cases, and then begin to fall towards the end of March.
According to Independent SAGE the Kraken variant XB.1.5 now makes up about 20% of cases. Booster vaccinations are no longer available but first and second jabs can still be obtained. Vaccination is said to reduce the likelyhood of death, severe illness and Long COVID
COVID video updates
Links to updates by Professor Tim Spector of the Zoe Health Study, Independent SAGE and pundit Dr John Campbell can sometimes be found here:-
Prof Tim Spector has moved on to new pastures, monitoring other health issues, food science and writing books, so his work supporting us through the COVID pandemic looks done - thank you Tim, and your team, for all your hard work.
The last Independent SAGE update was on 3rd March and the next one will be on 24th.
Click to watch Independent SAGE update on 3rd March 2023
Join Independant SAGE for a session on disinformation and how it spreads, with guests Prof Deborah Lupton and Prof Stephan Lewandowsky, hosted by Prof Trish Greenhalgh, Dr Stephen Griffin and Prof Martin McKee, chaired by Prof Anthony Costello; starting with trends and numbers by Prof Christina Pagel.
List of vaccines
Section deleted. Refer to archived pages for historical information about vaccines.
Summary of Links
Some of this information is now out of date but provides a historical context to the epidemic.
Information about Coronavirus can be found on the NHS website:
https://www.nhs.uk/coronavirus
Symptoms
Note: the list of symptoms was updated on 1st April 2022
Article about the effects of Wuhan Coronavirus on the human body
Reporting and how to obtain a test
How to get a test
https://www.nhs.uk/coronavirus
About joining the Zoe COVID Symptom Study:
Guidance
UK government Coronavirus guidance
See also - government sets out next steps for living with COVID
COVID-19 Response: Autumn and Winter Plan 2021 for England
UK Health and Security Agency (UKHSA) website
COVID Alert states
Guidance on UK COVID-19 alert level methodology: an overview
COVID-19 Alert Level lowered to 3 on 10th May 2021
Tiers
Guidance on tiers: what you need to know
Government postcode checker to find tier for other areas
Statistics
UK government COVID-19: Omicron daily overview
UK government Coronavirus Dashboard
Coronavirus Dashboard Interactive Map
ONS data on deaths in England and Wales (Excel spreadsheet)
NHS England COVID-19 Daily Deaths
NHS England COVID-19 Hospital Admissions
NHS England vaccination statistics
Worcestershire Coronavirus Dashboard
Worcestershire COVID-19 Vaccinations Dashboard
HSA COVID-19 vaccine weekly surveillance reports
Information about NHS hospital bed numbers: past, present, future
A glimpse of the worldwide vaccination situation can be found on the Our World in Data website.
Click for chart showing % vaccinated
A video with Dr John Campbell and mathematician Professor Fenton explaining the various ways in which RISK can be specified.
Risks and benefits with Professor Fenton
Modelling
A forecast of the progression of the COVID-19 epidemic can be found on a University College London (UCL) website.
Click for UCL Long-term forecasting of the COVID-19 epidemic
A projection of the future COVID-19 death toll and daily deaths can be found on The Institute for Health Metrics and Evaluation website.
Click for IHME projection of COVID-19 deaths
Reports
Coronavirus (COVID-19) latest insights by ONS
A live roundup of the latest data and trends about the coronavirus (COVID-19) pandemic from the ONS and other sources.
MedRxiv is a US preprint server for Health Sciences. A depository for reports which have still to be peer reviewed.
COVID-19 rapid guideline: managing the long-term effects of COVID-19
NICE guidance on managing Long COVID
The bigger picture
Worldometer summary of coronavirus cases worldwide
European Centre for Disease Prevention and Control info
https://www.ecdc.europa.eu/en/geographical-distribution-2019-ncov-cases
World Health Organisation info
Window on the USA
Centre for Disease Control (CDC)
Find maps and charts tracking cases, deaths, and trends of COVID-19 in the United States.
American Association of Retired People (AARP)
Worcestershire
A local summary of COVID data can be found on the Worcestershire Coronavirus Dashboard.
Note 1: use the arrow <> buttons at the bottom of the Dashboard screen to move between pages.
Note 2: the figures for COVID cases are becoming meaningless as testing is run down.
Note 3: deaths are on page 7, and hospital beds on page 9.
Click for Worcestershire County Council COVID-19 news
There is a colourful webpage offering advice on learning to live with COVID for those aged under 30 years. 'Rona' is slang for Coronavirus.
Click for The Worcestershire 'Rona' Hub
Click for Simple Summary of Malvern numbers on the Coronavirus dashboard
Miscellaneous
Spanish Flu
Dr Jeff Kildea's commentary about the 1919 outbreak of Spanish Flu in Australia
Views of Martin McKee, Professor of European Public Health
Follow Martin McKee on Twitter
Views of Prof Christina Pagel, a member of Independent SAGE
Follow Christina Pagel on Twitter
SAGE membership
Scientific Advisory Group for Emergencies (SAGE)
Scottish government:
Link to Scottish Government website
Link to Postcode checker for COVID restrictions by protection level in areas of Scotland
Welsh Government:
Guidance on COVID alert levels in Wales
Bibliography
Woolhouse, Professor Mark, The Year the World went Mad, published 2022 by Sandstone Press Ltd, ISBN: 978-1-913207-94-3
Medinger Dez, Altmann Danny, The Long Covid Handbook, Penguin Books, 2022. Kindle version available.
![]()
The interpretations and opinions expressed are our own
Last updated 5th March 2023