Angus and Rosemary's Miscellany
of Malvern - Other Resources
|
Occasional Coronavirus (COVID-19) update for Malvern SeniorsClick to read our observations on politics and world events 1st September 2023
Cases of COVID fell rapidly during the spring and early summer but are now beginning to rise, so once again we will be keeping an eye on the figures. COVID related deaths fell to just 65 per week in England and Wales towards the end of July but have doubled in the last three weeks, while the Coronavirus dashboard suggests weekly hospital admissions in England have risen from 757 in July towards 2,500 as August comes to a close. The BBC reports that the issue of COVID Autumn boosters will now start rolling out in September rather than in October as the government had planned. Those aged 65 years and over, and at risk groups will be eligible. You may be offered annual Flu and COVID booster jabs at the same time at your GP surgery. Our surgery is currently making appointments for Flu jabs only as delivery dates for the COVID booster are not yet known. Although nobody is taking precautions, we are hearing of cases in Malvern. While for most this may be no more than a cold, the unfortunate few can be very seriously affected, so it may be a good idea to get your booster when the time comes. PreambleThose wishing to monitor the figures will still find a summary on the Coronavirus Dashboard which continues to be updated weekly at 4 pm on Thursdays. Following a summer break, fortnightly Independent SAGE briefings are expected to resume on 8th September 2023. If you are familiar with Excel spreadsheets, NHS England hospital admissions and beds; and deaths reported by ONS continue to be a measure of COVID-19 in the UK. You will see this is a cut down version of our weekly reports during the height of the epidemic. ContentsSummaryThe incidence of COVID-19 which fell to a minimum in July 2023 is beginning to rise. This could well be due to waning immunity and mutating variants, but the symptoms are thought to be no worse than from the Omicron strain. Autumn Boosters for those aged 65+ wishing to top up their immunity should become available at GP surgeries between 12th September and 23rd December 2023. If you catch COVID for a second or perhaps even a third time it is likely to be a mild illness, though you might feel quite poorly and be left feeling very tired. However the unlucky few might suffer breathing difficulties and become severely ill. (Definitions: mild = treatable at home; severe = treated in hospital). What happens if you get sick with COVIDIf you are feeling poorly it might not be COVID-19 but some other respiratory illness. Whatever the virus best stay at home until you feel better, and wear a face mask to protect others if you do have to go out. Nowadays, you probably won't know it's COVID and brush it off as just another cold. You now have to buy test kits. Pharmacies do not always have these and the results can be uncertain. Despite vaccination, some of those who have caught COVID report either getting easily tired or suffering from shortness of breath for some weeks afterwards; if so patients are advised to take it easy until fully recovered as there seems to be no 'one size fits all' treatment. A small number of patients (less than 10%) report debilitating symptoms for months after so-called recovery especially middle aged women. See Dez Medinger and Danny Altmann's book The Long COVID Handbook in bibliography. PrecautionsVaccination SitesExpect Autumn booster vaccinations to be offered to those aged 65+ at GP surgeries between September and December 2023. Either your GP surgery or the NHS will contact you, for example as part of the annual Flu campaign.
|
| Date of screenshot | Prevalence (UK) | Estimated new infections per day |
| 23rd March 2023 | 1,404,346 | 111,241 |
| 30th March 2023 | 1,499,083 | 105,172 |
| 31st August 2023 | 1,089,579 | 85,321 |
Prevalence of COVID-19 in UK estimated by the Zoe Health Study
A Zoe graph shows Prevalence, or Active Cases, doubling since early July.
The numbers suggest that roughly 1 in 50 people are currently suffering from COVID.
 Number
of deaths
Number
of deaths
ONS figures
The Office of National Statistics (ONS) reports registered deaths in England and Wales where COVID-19 is mentioned somewhere on the death certificate. The ONS figures lag real time by 10 - 14 days due to the administrative delay in submitting and processing reports, and do not include Northern Ireland and Scotland.
Note: the figures include cases where COVID may have been a secondary cause of death.
Click for ONS data on deaths (Excel spreadsheet)
ONS figures for Worcestershire by date reported
There are currently very few COVID deaths in Worcestershire so the table below has not been updated.
The ONS figures can be filtered by Local Authority providing a glimpse of where deaths are occurring. The provisional cumulative total of COVID related deaths in Worcestershire reported by the ONS up to 17th March (week 11 of 2023) is shown in the table below.
Note: these numbers are derived from Table 1 of the ONS Death Registrations spreadsheet using the in-built filters. This gives the provisional total of deaths registered in any week, which can be distorted by delayed reporting, for example, due to public holidays.
Deaths by Welsh Health Boards are excluded to avoid duplication as these are totals of Local authorities.
| Districts of Worcs |
Deaths 2020 |
Deaths 2021 |
Deaths 2022 |
Deaths 2023 |
Week 11 | Population |
| Bromsgrove | 164 | 142 | 59 | 11 | 0 | 98,529 |
| Malvern Hills | 61 | 98 | 74 | 10 | 1 | 77,545 |
| Redditch | 108 | 109 | 47 | 10 | 0 | 85,317 |
| Worcester | 87 | 134 | 51 | 6 | 0 | 103,542 |
| Wychavon | 157 | 154 | 85 | 17 | 2 | 126,240 |
| Wyre Forest | 171 | 132 | 62 | 8 | 0 | 100,957 |
| TOTAL | 748 | 769 | 378 | 62 | 3 | 592,130 |
Provisional cumulative COVID-19 deaths in Worcestershire registered by ONS to 17th March 2023.
There was 1 death in a care home in the Malvern Hills; and 2 deaths in hospital in Wychavon.
The current picture is of very few weekly deaths in Worcestershire from COVID.
ONS figures for England and Wales by date reported
NEW
In England and Wales 125 COVID-19 related deaths were reported in the week to 18th August 2023, double three weeks before. Before getting too alarmed note that deaths are at a much lower level than at the start of the year.
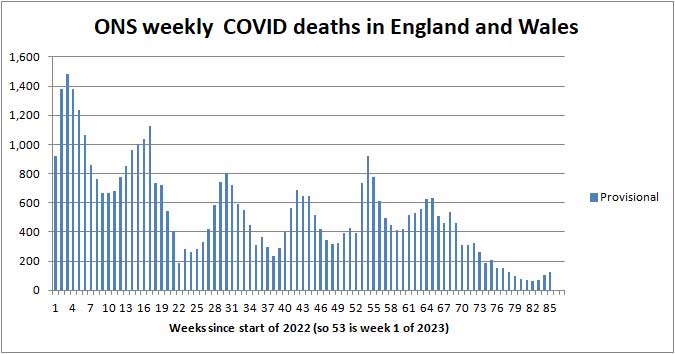
ONS provisional deaths 'by week reported' in England and Wales since the start of 2022 (so week 53 is week 1 of 2023)
ONS figures for England and Wales by date of death
This section has not been updated.
Table 2 of the ONS spreadsheet gives England and Wales figures by date of death. This is a more accurate metric but it takes an additional two to three weeks for most of the registrations to flow in; see extract in the table below.
| Week of 2023 | Number of deaths reported last week |
Number of deaths reported this week |
| 1 | 813 | 816 |
| 2 | 691 | 694 |
| 3 | 573 | 575 |
| 4 | 451 | 453 |
| 5 | 425 | 428 |
| 6 | 400 | 401 |
| 7 | 409 | 410 |
| 8 | 447 | 452 |
| 9 | 474 | 490 |
| 10 | 405 | 549 (incomplete) |
| 11 | - | 407 (incomplete) |
ONS weekly COVID deaths in England and Wales - 'by date of death'
Averaged over recent years roughly 1,700 people die daily from all causes in the UK.
NHS England figures for deaths
Figures for COVID deaths are no longer published by the NHS.
Risk of COVID-19 death by age band
NHS England provides an analysis of COVID-19 deaths in hospital in England and Wales by age band. Shown below is a snapshot of 2,898 deaths for the period 6th May 2022 to 6th July 2022 when most of these deaths will have been from the Omicron variants.
| Age band | Number of COVID deaths | % of deaths |
| 0 - 19 | 8 | 0.3 |
| 20 - 39 | 25 | 0.9 |
| 40 - 59 | 165 | 5.7 |
| 60 - 79 | 1,010 | 34.9 |
| 80+ | 1,692 | 58.4 |
Relative risk of COVID-19 death by age band May - July 2022
The main point to note is those aged 60+ account for 93% of deaths despite young people being more likely to catch COVID-19.
The risk profile for Omicron appears to be the same as for Delta. Age is still the greatest risk factor; perhaps reflecting that older people have more health problems.
According to the Coronavirus Dashboard sex is an additional risk factor - males are roughly 50% more likely to die than women; possibly because women have a stronger immune system.
Healthcare numbers
The UK government Coronavirus Dashboard includes information about healthcare statistics and NHS bed occupancy.
| Hospital COVID cases (England) | Number | Last week |
| Patients currently in hospital | 2,503 | N/A |
| Patients on ventilation | 79 | N/A |
| Patients admitted weekly | 2,257 | N/A |
Headline summary of patients in hospital reported on 31st August 2023
Also see charts on the Coronavirus Dashboard and below.
Bed numbers by region in England
Tabulated figures for COVID bed occupancy in England can be found on the NHS England website providing another indicator of the prevalence of COVID.
Click for NHS England COVID-19 Hospital bed Activity statistics
Note: see the latest Daily Admissions and Beds spreadsheets, then look for all COVID beds.
| Region | 1st August 2023 | 27th August 2023 | 15th January 2021 |
| England | 1,674 | 2,501 | 33,362 |
| London | 290 | 457 | 7,811 |
| Midlands | 309 | 449 | 5,890 |
Comparison of All beds COVID data for England, London and Midlands
For comparison, the number of beds occupied during the peak of the epidemic in January 2021 is shown in red in the right hand column of the table.
The chart below shows how COVID bed occupancy varied earlier in the year.
Note: the peak in beds is seems to be roughly one week delayed on the peak in daily admissions, and deaths lag beds by a further week.
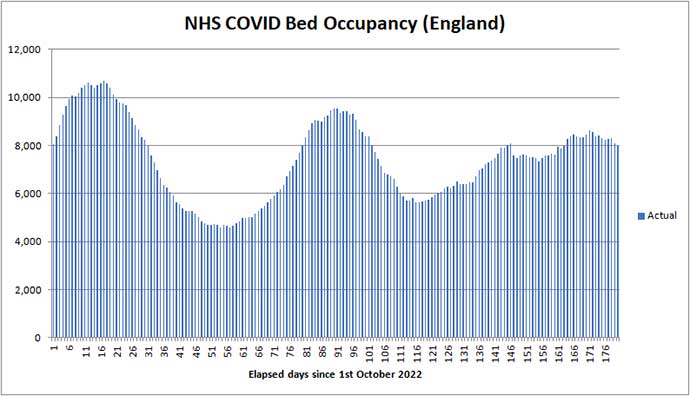
COVID bed occupancy in England from 1st October to 29th March 2023
Worcestershire hospital beds
Click for Summary of Malvern numbers on the Coronavirus dashboard
The Worcestershire Coronavirus dashboard appears to have been retired.
Forecast for the week ahead
No forecast as COVID not currently an issue.
Longer term outlook
It looks like cases will go up a bit during Autumn and the Winter but we have no idea by how much or how this will affect the public's health.
Advice for Seniors
The government seems to have largely washed its hands of COVID considering to be just one of many viruses in circulation.
We no longer have any feel for the benefits of booster vaccinations or the health risks posed by the latest variants in circulation so can only offer observations.
The risk of exposure to COVID-19 is probably quite high in England, while there are many other seasonal respiratory viruses circulating that could make you feel just as poorly.
There is no evidence that COVID is currently causing alarming numbers of people in Worcestershire to fall severely ill; so for most, the risk might perhaps be considered LOW.
Consequently our riskometer currently shows LOW (see opposite).
Many, perhaps most, healthy people continue to take the view that COVID is no longer a critical threat to their health.
For the more cautious the simple safeguards to protect against all respiratory infections, have been to:
-
make sure your vaccinations are up to date, noting Flu and COVID booster jabs for those aged 65+ years are expected to be available between September and December 2023.
-
wash your HANDS thoroughly, using soap and hot water, for 20 seconds, including after handling deliveries to your home, to kill virus picked up from contaminated surfaces (see note 1);
-
ideally wear either a well fitting FACE covering, or better still an FFP2 (N95) face mask when in crowded settings for example when in shops, theatres, health-care settings, when using public transport, and travelling by air;
-
SPACE at least 2 metres from people you don't feel safe with (see note 2);
-
preferably socialise with friends and other households outdoors in the FRESH AIR else, if you are indoors, either ventilate by keeping windows open as far as is practicable or consider putting a HEPA air purifier in the room;
-
avoid crowded indoor settings and friends and colleagues with cold and flu like symptoms;
-
stay at home to protect others if you yourself feel unwell with cold or flu like symptoms;
-
respect others and give them space;
Notes:
1) Wash your hands thoroughly before touching your face to avoid transferring virus from contaminated surfaces to your mouth, eyes and nose. If outdoors, for example filling the car up with fuel, either wash hands with an alcohol based hand gel after touching suspect surfaces or wear gloves.
2) Two metres is further than you think - roughly an arm and a walking stick away.
3) If you are 'clinically vulnerable' consult your GP or specialist; you may need to take a test and consider anti viral drugs if testing positive.
Annex
Commentary
This occasional update is simply to highlight cases of COVID-19 are once again rising. We don't know how effective the booster vaccines are but it might be a good idea to get your Autumn booster especially if you missed the Spring booster.
If you reacted badly to getting the Flu and COVID boosters at the same time last year you might want to consider getting them a couple of weeks apart.
Independent SAGE
The next Independent SAGE fortnightly update is expected 8th September 2023.
You can watch a previous briefing by clicking the link below.
Click to watch Independent SAGE update on 24th March 2023
List of vaccines
Section deleted. Refer to archived pages for historical information about vaccines.
Summary of Links
Some of this information is now out of date but provides a historical context to the epidemic.
Information about Coronavirus can be found on the NHS website:
https://www.nhs.uk/coronavirus
Symptoms
Note: the list of symptoms was updated on 1st April 2022
Article about the effects of Wuhan Coronavirus on the human body
Reporting and how to obtain a test
How to get a test
https://www.nhs.uk/coronavirus
About joining the Zoe COVID Symptom Study:
Guidance
UK government Coronavirus guidance
See also - government sets out next steps for living with COVID
COVID-19 Response: Autumn and Winter Plan 2021 for England
UK Health and Security Agency (UKHSA) website
COVID Alert states
Guidance on UK COVID-19 alert level methodology: an overview
COVID-19 Alert Level lowered to 3 on 10th May 2021
Tiers
Guidance on tiers: what you need to know
Government postcode checker to find tier for other areas
Statistics
UK government COVID-19: Omicron daily overview
UK government Coronavirus Dashboard
Coronavirus Dashboard Interactive Map
ONS data on deaths in England and Wales (Excel spreadsheet)
NHS England COVID-19 Daily Deaths
NHS England COVID-19 Hospital Admissions
NHS England vaccination statistics
Worcestershire Coronavirus Dashboard
Worcestershire COVID-19 Vaccinations Dashboard
HSA COVID-19 vaccine weekly surveillance reports
Information about NHS hospital bed numbers: past, present, future
A glimpse of the worldwide vaccination situation can be found on the Our World in Data website.
Click for chart showing % vaccinated
A video with Dr John Campbell and mathematician Professor Fenton explaining the various ways in which RISK can be specified.
Risks and benefits with Professor Fenton
Modelling
A forecast of the progression of the COVID-19 epidemic can be found on a University College London (UCL) website.
Click for UCL Long-term forecasting of the COVID-19 epidemic
A projection of the future COVID-19 death toll and daily deaths can be found on The Institute for Health Metrics and Evaluation website.
Click for IHME projection of COVID-19 deaths
Reports
Coronavirus (COVID-19) latest insights by ONS
A live roundup of the latest data and trends about the coronavirus (COVID-19) pandemic from the ONS and other sources.
MedRxiv is a US preprint server for Health Sciences. A depository for reports which have still to be peer reviewed.
COVID-19 rapid guideline: managing the long-term effects of COVID-19
NICE guidance on managing Long COVID
The bigger picture
Worldometer summary of coronavirus cases worldwide
European Centre for Disease Prevention and Control info
https://www.ecdc.europa.eu/en/geographical-distribution-2019-ncov-cases
World Health Organisation info
Window on the USA
Centre for Disease Control (CDC)
Find maps and charts tracking cases, deaths, and trends of COVID-19 in the United States.
American Association of Retired People (AARP)
Worcestershire
A local summary of COVID data can be found on the Worcestershire Coronavirus Dashboard.
Note 1: use the arrow <> buttons at the bottom of the Dashboard screen to move between pages.
Note 2: the figures for COVID cases are becoming meaningless as testing is run down.
Note 3: deaths are on page 7, and hospital beds on page 9.
Click for Worcestershire County Council COVID-19 news
There is a colourful webpage offering advice on learning to live with COVID for those aged under 30 years. 'Rona' is slang for Coronavirus.
Click for The Worcestershire 'Rona' Hub
Click for Simple Summary of Malvern numbers on the Coronavirus dashboard
Miscellaneous
Spanish Flu
Dr Jeff Kildea's commentary about the 1919 outbreak of Spanish Flu in Australia
Views of Martin McKee, Professor of European Public Health
Follow Martin McKee on Twitter
Views of Prof Christina Pagel, a member of Independent SAGE
Follow Christina Pagel on Twitter
SAGE membership
Scientific Advisory Group for Emergencies (SAGE)
Scottish government:
Link to Scottish Government website
Link to Postcode checker for COVID restrictions by protection level in areas of Scotland
Welsh Government:
Guidance on COVID alert levels in Wales
Bibliography
Woolhouse, Professor Mark, The Year the World went Mad, published 2022 by Sandstone Press Ltd, ISBN: 978-1-913207-94-3
Medinger Dez, Altmann Danny, The Long Covid Handbook, Penguin Books, 2022. Kindle version available.
![]()
The interpretations and opinions expressed are our own
Last updated 4th September 2023